Tag: sdn

Trunk ports in OVN

The purpose of this post is explaining the low level details of how trunking works in OVN. A typical use case of trunk ports could be the use of nested VMs or containers inside VMs; where all the traffic is directed to the vNIC of the virtual machine and then forwarded to the right container based on their VLAN ID. For more context around the feature and use cases, please check out the OpenStack documentation guide.

Let’s take a very simple topology for our deep dive. You can also deploy it in your machine using this vagrant setup and replay the commands as we go 🙂

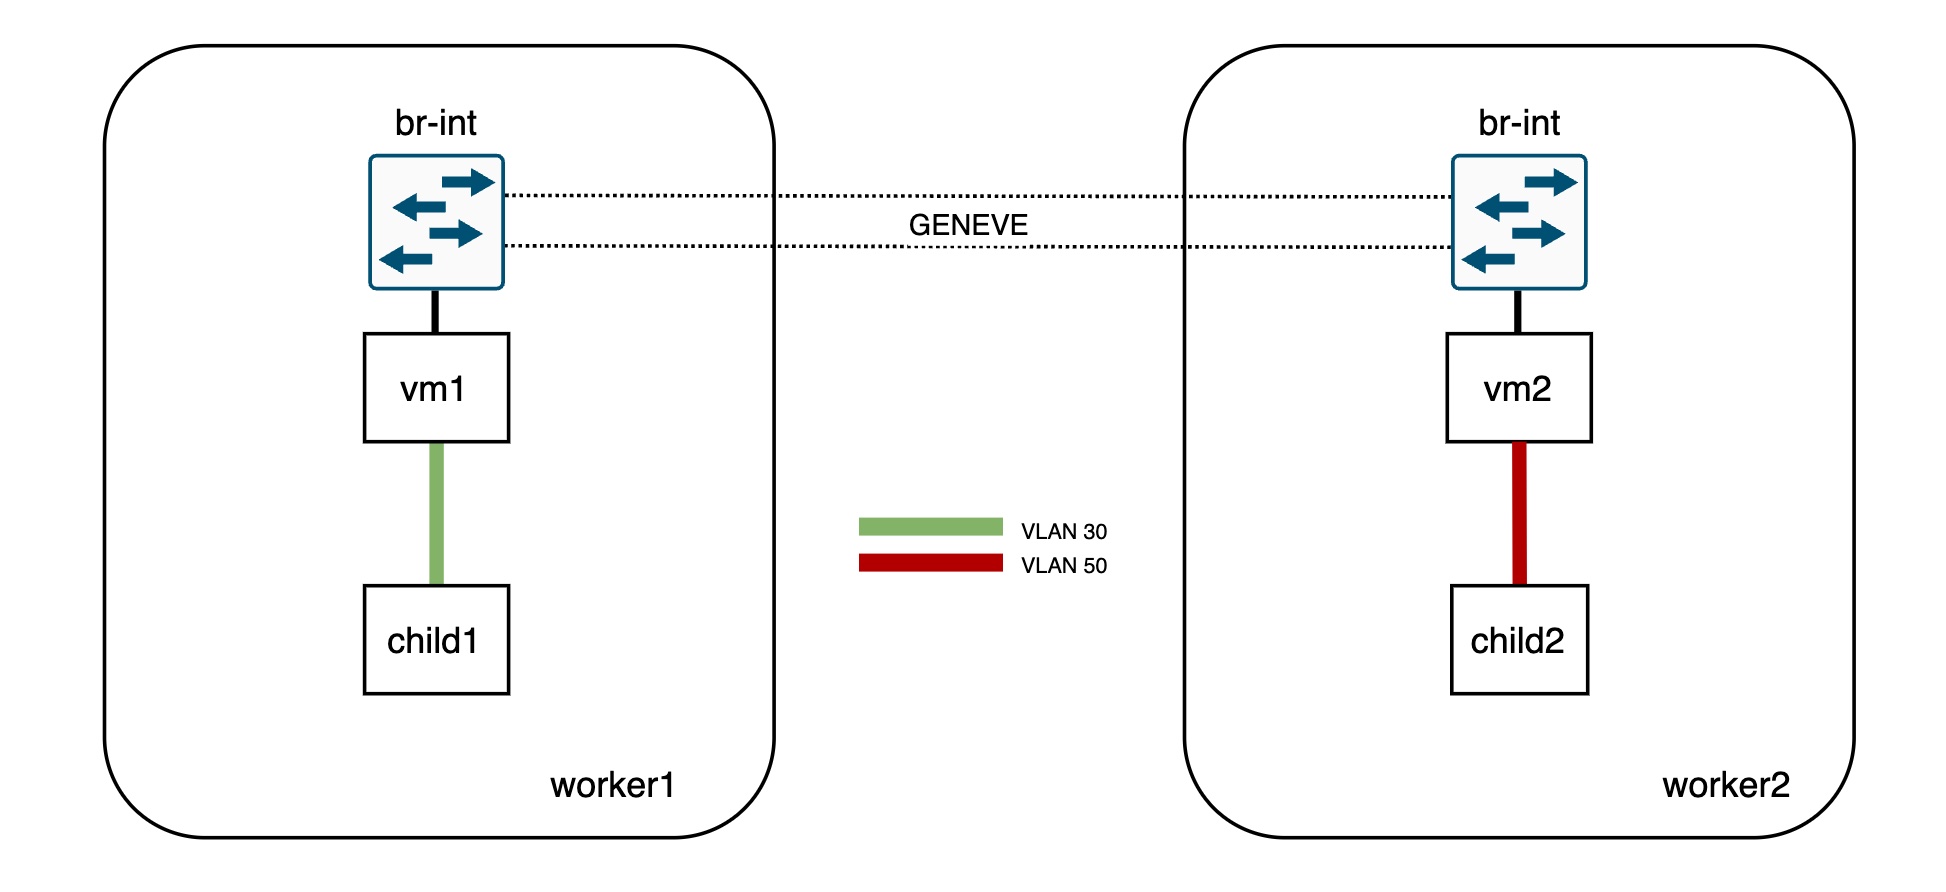
This sample setup has two Logical Switches and two ports on each of them. The physical layout is as follows:

  • vm1 bound to worker1
  • vm2 bound to worker2
  • child1 (VLAN 30) inside vm1
  • child2 (VLAN 50) inside vm2

Let’s quickly check the OVN databases info:

[root@central vagrant]# ovn-nbctl show
switch db4e7781-370c-4439-becd-35803c0e3f12 (network1)
    port vm1
        addresses: ["40:44:00:00:00:01 192.168.0.11"]
    port vm2
        addresses: ["40:44:00:00:00:02 192.168.0.12"]
switch 40ac144b-a32a-4202-bce2-3329f8f3e98f (network2)
    port child1
        parent: vm1
        tag: 30
        addresses: ["40:44:00:00:00:03 192.168.1.13"]
    port child2
        parent: vm2
        tag: 50
        addresses: ["40:44:00:00:00:04 192.168.1.14"]


[root@central vagrant]# ovn-sbctl show
Chassis worker2
    hostname: worker2
    Encap geneve
        ip: "192.168.50.101"
[root@central vagrant]# ovn-sbctl show
Chassis worker2
    hostname: worker2
    Encap geneve
        ip: "192.168.50.101"
        options: {csum="true"}
    Port_Binding child2
    Port_Binding vm2
Chassis worker1
    hostname: worker1
    Encap geneve
        ip: "192.168.50.100"
        options: {csum="true"}
    Port_Binding child1
    Port_Binding vm1

Instead of booting actual VMs and containers, I simulated it with network namespaces and VLAN devices inside them:

[root@worker1 vagrant]# ip netns exec vm1 ip -d link show
1: lo: <LOOPBACK> mtu 65536 qdisc noop state DOWN mode DEFAULT group default qlen 1000
    link/loopback 00:00:00:00:00:00 brd 00:00:00:00:00:00 promiscuity 0 addrgenmode eui64 numtxqueues 1 numrxqueues 1 gso_max_size 65536 gso_max_segs 65535
2: child1@vm1: <BROADCAST,MULTICAST,UP,LOWER_UP> mtu 1500 qdisc noqueue state UP mode DEFAULT group default qlen 1000
    link/ether 40:44:00:00:00:03 brd ff:ff:ff:ff:ff:ff promiscuity 0
    vlan protocol 802.1Q id 30 <REORDER_HDR> addrgenmode eui64 numtxqueues 1 numrxqueues 1 gso_max_size 65536 gso_max_segs 65535
24: vm1: <BROADCAST,MULTICAST,UP,LOWER_UP> mtu 1500 qdisc noqueue state UNKNOWN mode DEFAULT group default qlen 1000
    link/ether 40:44:00:00:00:01 brd ff:ff:ff:ff:ff:ff promiscuity 2
    openvswitch addrgenmode eui64 numtxqueues 1 numrxqueues 1 gso_max_size 65536 gso_max_segs 65535


[root@worker2 vagrant]# ip netns exec vm2 ip -d link show
1: lo: <LOOPBACK> mtu 65536 qdisc noop state DOWN mode DEFAULT group default qlen 1000
    link/loopback 00:00:00:00:00:00 brd 00:00:00:00:00:00 promiscuity 0 addrgenmode eui64 numtxqueues 1 numrxqueues 1 gso_max_size 65536 gso_max_segs 65535
2: child2@vm2: <BROADCAST,MULTICAST,UP,LOWER_UP> mtu 1500 qdisc noqueue state UP mode DEFAULT group default qlen 1000
    link/ether 40:44:00:00:00:04 brd ff:ff:ff:ff:ff:ff promiscuity 0
    vlan protocol 802.1Q id 50 <REORDER_HDR> addrgenmode eui64 numtxqueues 1 numrxqueues 1 gso_max_size 65536 gso_max_segs 65535
15: vm2: <BROADCAST,MULTICAST,UP,LOWER_UP> mtu 1500 qdisc noqueue state UNKNOWN mode DEFAULT group default qlen 1000
    link/ether 40:44:00:00:00:02 brd ff:ff:ff:ff:ff:ff promiscuity 2
    openvswitch addrgenmode eui64 numtxqueues 1 numrxqueues 1 gso_max_size 65536 gso_max_segs 65535

Now, as you can see, none of the subports (child1 and child2) are connected directly to the integration bridge so both vm1 and vm2 ports act as trunk ports for VLAN IDs 30 and 50. OVN will install flows to tag/untag the traffic directed to/from these ports.


Traffic and OpenFlow analysis

To illustrate this, let’s ping from child1 (worker1) to child 2 (worker2):

[root@worker1 vagrant]# ip netns exec vm1 ping 192.168.1.14
PING 192.168.1.14 (192.168.1.14) 56(84) bytes of data.
64 bytes from 192.168.1.14: icmp_seq=21 ttl=64 time=0.824 ms
64 bytes from 192.168.1.14: icmp_seq=22 ttl=64 time=0.211 ms

The traffic will arrive tagged to the vm1 interface and will be sent out untagged to worker2 (where vm2 is bound) via the Geneve tunnel:

[root@worker1 ~]# ip netns exec vm1 tcpdump -vvnee -i vm1 icmp -c1

tcpdump: listening on vm1, link-type EN10MB (Ethernet), capture size 262144 bytes
13:18:16.980650 40:44:00:00:00:03 > 40:44:00:00:00:04, ethertype 802.1Q (0x8100), length 102: vlan 30, p 0, ethertype IPv4, (tos 0x0, ttl 64, id 55255, offset 0, flags [DF], proto ICMP (1), length 84)
    192.168.1.13 > 192.168.1.14: ICMP echo request, id 9833, seq 176, length 64


[root@worker1 ~]# tcpdump -vvneei genev_sys_6081 icmp -c1

tcpdump: listening on genev_sys_6081, link-type EN10MB (Ethernet), capture size 262144 bytes
13:19:11.980671 40:44:00:00:00:03 > 40:44:00:00:00:04, ethertype IPv4 (0x0800), length 98: (tos 0x0, ttl 64, id 16226, offset 0, flags [DF], proto ICMP (1), length 84)
    192.168.1.13 > 192.168.1.14: ICMP echo request, id 9833, seq 231, length 64

On worker1, let’s inspect the OVS flows that determine the source network/port based on the VLAN ID:

[root@worker1 ~]# ovs-ofctl dump-flows br-int table=0 |grep vlan

 cookie=0x4b8d6fa5, duration=337116.380s, table=0, n_packets=270983, n_bytes=27165634, idle_age=0, hard_age=65534, priority=150,in_port=12,dl_vlan=30 actions=load:0x1->NXM_NX_REG10[5],strip_vlan,load:0x5->NXM_NX_REG13[],load:0x1->NXM_NX_REG11[],load:0x2->NXM_NX_REG12[],load:0x2->OXM_OF_METADATA[],load:0x1->NXM_NX_REG14[],resubmit(,8)

The flow above in table 0 matches on the VLAN tag (dl_vlan=30). Also, note that there’s no matching flow for VLAN 50 as vm2 is not bound to worker1.

As each parent should have subports with unique VLAN IDs, this ID will determine the source port (nested VM or container) that is sending the traffic. In our example, this will be child1 as it is the subport tagged with VLAN 30. In the actions section of the table 0 flow, the packet will be untagged (strip_vlan action), and the relevant registers will be populated to identify both the subport network and the logical input port:

  • The packet is coming from OF port 12 (in_port=12) which corresponds to vm1
[root@worker1 ~]# ovs-ofctl show br-int | grep vm1
 12(vm1): addr:40:44:00:00:00:01
  • The network identifier (metadata) is populated with the value 2 (load:0x2->OXM_OF_METADATA[]) which corresponds to the network of the subport (network2)
[root@central ~]# ovn-sbctl find datapath_binding tunnel_key=2
_uuid               : 2d762d73-5ab9-4f43-a303-65a6046e41e7
external_ids        : {logical-switch="40ac144b-a32a-4202-bce2-3329f8f3e98f", name=network2}
load_balancers      : []
tunnel_key          : 2
  • The logical input port (register 14) will be populated with the tunnel key of the child1 subport (load:0x1->NXM_NX_REG14[])
[root@central vagrant]# ovn-sbctl get port_binding child1 tunnel_key
1
  • Now the pipeline execution with the untagged packet gets resumed from table 8 (resubmit(,8)). Eventually it gets sent through the tunnel to worker2, where the parent (vm2) of the destination port (child2) is bound to.


Let’s inspect the traffic and flows on worker2, the destination hypervisor:

The traffic arrives untagged to br-int from the Geneve interface and later gets delivered to the vm2 interface tagged with the child2 VLAN ID (50).

[root@worker2 vagrant]# tcpdump -vvnee -i genev_sys_6081 icmp -c1
tcpdump: listening on genev_sys_6081, link-type EN10MB (Ethernet), capture size 262144 bytes
13:57:25.000587 40:44:00:00:00:03 > 40:44:00:00:00:04, ethertype IPv4 (0x0800), length 98: (tos 0x0, ttl 64, id 56431, offset 0, flags [DF], proto ICMP (1), length 84)
    192.168.1.13 > 192.168.1.14: ICMP echo request, id 10218, seq 31, length 64


[root@worker2 vagrant]# ip netns exec vm2 tcpdump -vvneei vm2 icmp -c1
tcpdump: listening on vm2, link-type EN10MB (Ethernet), capture size 262144 bytes
13:57:39.000617 40:44:00:00:00:03 > 40:44:00:00:00:04, ethertype 802.1Q (0x8100), length 102: vlan 50, p 0, ethertype IPv4, (tos 0x0, ttl 64, id 59701, offset 0, flags [DF], proto ICMP (1), length 84)
    192.168.1.13 > 192.168.1.14: ICMP echo request, id 10218, seq 45, length 64

The packet processing takes place as with any regular VIF but in the output stage, the traffic will be tagged before it is sent out to the vm2 interface:

[root@worker2 vagrant]# ovs-ofctl dump-flows br-int |grep mod_vlan_vid:50
 cookie=0x969b8a9d, duration=338995.147s, table=65, n_packets=263914, n_bytes=25814112, idle_age=0, hard_age=65534, priority=100,reg15=0x2,metadata=0x2 actions=mod_vlan_vid:50,output:4,strip_vlan

[root@worker2 vagrant]# ovs-ofctl show br-int | grep vm2
 4(vm2): addr:00:00:00:00:00:00


As you can see, the way that OVN implements this feature is very simple and only adds a couple of extra flows. Hope that this article helps understanding the details of trunk ports and how it’s leveraged by projects like Kuryr to run Kubernetes on top of OpenStack.

OpenStack TripleO networking layout

The goal of this post is to describe how network isolation is typically achieved for both the control and data planes in OpenStack using TripleO. In particular, how all this happens in a virtual setup, using one baremetal node (hypervisor, from now on) to deploy the OpenStack nodes with libvirt. For the purpose of this post, we’ll work with a 3 controllers + 1 compute virtual setup.

(undercloud) [stack@undercloud-0 ~]$ openstack server list
+--------------------------------------+--------------+--------+------------------------+
| ID | Name | Status | Networks |
+--------------------------------------+--------------+--------+------------------------+
| b3bd5157-b3ea-4331-91af-3820c4e12252 | controller-0 | ACTIVE | ctlplane=192.168.24.15 |
| 6f228b08-49a0-4b68-925a-17d06224d5f9 | controller-1 | ACTIVE | ctlplane=192.168.24.37 |
| e5c649b5-c968-4293-a994-04293cb16da1 | controller-2 | ACTIVE | ctlplane=192.168.24.10 |
| 9f15ed23-efb1-4972-b578-7b0da3500053 | compute-0 | ACTIVE | ctlplane=192.168.24.14 |
+--------------------------------------+--------------+--------+------------------------+

The tool used to deploy this setup is Infrared (documentation) which is an easy-to-use wrapper around TripleO. Don’t be scared about the so many layers involved here; the main point is to understand that a physical – and somewhat powerful – server is running an OpenStack cluster formed by:

  • 3 virtual controllers that run the OpenStack control plane services (Neutron, Nova, Glance, …)
  • 1 virtual compute node that will serve to host the workloads (virtual machines) of the OpenStack cluster 

From a Networking perspective (I’ll omit the undercloud for simplicity), things are wired like this:

Let’s take a look at the bridges in the hypervisor node:

[root@hypervisor]# brctl show

bridge name     bridge id               STP enabled     interfaces
management      8000.525400cc1d8b       yes             management-nic
                                                        vnet0
                                                        vnet12
                                                        vnet3
                                                        vnet6
                                                        vnet9

external        8000.5254000ceb7c       yes             external-nic
                                                        vnet11
                                                        vnet14
                                                        vnet2
                                                        vnet5
                                                        vnet8

data            8000.5254007bc90a       yes             data-nic
                                                        vnet1
                                                        vnet10
                                                        vnet13
                                                        vnet4
                                                        vnet7

Each bridge has 6 ports (3 controllers, 1 compute, 1 undercloud, and the local port in the hypervisor). Now, each virtual machine running in this node can be mapped to the right interface:

[root@hypervisor]# for i in controller-0 controller-1 controller-2 compute-0; do virsh domiflist $i; done


 Interface   Type      Source       Model    MAC
----------------------------------------------------------------
 vnet9       network   management   virtio   52:54:00:74:29:4f
 vnet10      network   data         virtio   52:54:00:1c:44:26
 vnet11      network   external     virtio   52:54:00:20:3c:4e

 Interface   Type      Source       Model    MAC
----------------------------------------------------------------
 vnet3       network   management   virtio   52:54:00:0b:ad:3b
 vnet4       network   data         virtio   52:54:00:2f:9f:3e
 vnet5       network   external     virtio   52:54:00:75:a5:ed

 Interface   Type      Source       Model    MAC
----------------------------------------------------------------
 vnet6       network   management   virtio   52:54:00:da:a3:1e
 vnet7       network   data         virtio   52:54:00:57:26:67
 vnet8       network   external     virtio   52:54:00:2c:21:d5

 Interface   Type      Source       Model    MAC
----------------------------------------------------------------
 vnet0       network   management   virtio   52:54:00:de:4a:38
 vnet1       network   data         virtio   52:54:00:c7:74:4b
 vnet2       network   external     virtio   52:54:00:22:de:5c

Network configuration templates

This section will go through the Infrared/TripleO configuration to understand how this layout was defined. This will also help the reader to change the CIDRs, VLANs, number of virtual NICs, etc.

First, the deployment script:

$ cat overcloud_deploy.sh
#!/bin/bash

openstack overcloud deploy \
--timeout 100 \
--templates /usr/share/openstack-tripleo-heat-templates \
--stack overcloud \
--libvirt-type kvm \
-e /home/stack/virt/config_lvm.yaml \
-e /usr/share/openstack-tripleo-heat-templates/environments/network-isolation.yaml \
-e /home/stack/virt/network/network-environment.yaml \
-e /home/stack/virt/inject-trust-anchor.yaml \
-e /home/stack/virt/hostnames.yml \
-e /usr/share/openstack-tripleo-heat-templates/environments/services/neutron-ovn-ha.yaml \
-e /home/stack/virt/debug.yaml \
-e /home/stack/virt/nodes_data.yaml \
-e ~/containers-prepare-parameter.yaml \
-e /home/stack/virt/docker-images.yaml \
--log-file overcloud_deployment_99.log

Now, let’s take a look at the network related templates to understand the different networks and how they map to the physical NICs inside the controllers/compute nodes:

$ grep -i -e cidr -e vlan /home/stack/virt/network/network-environment.yaml
ControlPlaneSubnetCidr: '192.168.24.0/24'

ExternalNetCidr: 10.0.0.0/24
ExternalNetworkVlanID: 10

InternalApiNetCidr: 172.17.1.0/24
InternalApiNetworkVlanID: 20

StorageMgmtNetCidr: 172.17.4.0/24
StorageMgmtNetworkVlanID: 40

StorageNetCidr: 172.17.3.0/24
StorageNetworkVlanID: 30

TenantNetCidr: 172.17.2.0/24
TenantNetworkVlanID: 50

NeutronNetworkVLANRanges: tenant:1000:2000

OS::TripleO::Compute::Net::SoftwareConfig: three-nics-vlans/compute.yaml
OS::TripleO::Controller::Net::SoftwareConfig: three-nics-vlans/controller.yaml

In the output above you can see 6 different networks:

  • ControlPlane (flat): used mainly for provisioning (PXE) and remote access to the nodes via SSH.
  • External (VLAN 10): external network used for dataplane floating IP traffic and access to the OpenStack API services via their external endpoints.
  • InternalApi (VLAN 20): network where the OpenStack control plane services will listen for internal communication (eg. Neutron <-> Nova).
  • StorageMgmt (VLAN 40): network used to manage the storage (in this deployment, swift-object-server, swift-container-server, and swift-account-server will listen to requests on this network)   
  • Storage (VLAN 30): network used for access to the Object storage (in this deployment, swift-proxy will listen to requests on this network).
  • Tenant: this network will carry the overlay tunnelled traffic (Geneve for OVN, VXLAN in the case of ML2/OVS) in the VLAN 50 but will also carry dataplane traffic if VLAN tenant networks are used in Neutron. The VLAN range allowed for such traffic is specified also in the template (in the example, VLAN ids ranging from 1000-2000 are reserved for Neutron tenant networks).

The way that each NIC is mapped to each network is defined in the yaml files below. For this deployment, I used a customized layout via this patch (controller.yaml and compute.yaml). Essentially, the mapping looks like this:

  • Controllers:
    • nic1: ControlPlaneIp (flat); InternalApi (20), Storage (30) , StorageMgmt (40), VLAN devices
    • nic2: br-tenant OVS bridge and VLAN50 for the tunnelled traffic
    • nic3: br-ex OVS bridge for external traffic 
  • Compute:
    • nic1: ControlPlaneIp (flat); InternalApi (20), Storage (30), VLAN devices 
    • nic2: br-tenant OVS bridge and VLAN50 for the tunnelled traffic
    • nic3: br-ex OVS bridge for external traffic 

The nodes map nic1, nic2, nic3 to ens4, ens5, ens6 respectively:

[root@controller-0 ~]# ip l | egrep "vlan[2-4]0"
9: vlan20@ens3: <BROADCAST,MULTICAST,UP,LOWER_UP> mtu 1500 qdisc noqueue state UP mode DEFAULT group default qlen 1000
10: vlan30@ens3: <BROADCAST,MULTICAST,UP,LOWER_UP> mtu 1500 qdisc noqueue state UP mode DEFAULT group default qlen 1000
11: vlan40@ens3: <BROADCAST,MULTICAST,UP,LOWER_UP> mtu 1500 qdisc noqueue state UP mode DEFAULT group default qlen 1000

[root@controller-0 ~]# ovs-vsctl list-ports br-tenant
ens4
vlan50

[root@controller-0 ~]# ovs-vsctl list-ports br-ex
ens5

In the controller nodes we’ll find an haproxy instance load balancing the requests to the different nodes and we can see here the network layout as well:

[root@controller-1 ~]# podman exec -uroot -it haproxy-bundle-podman-1 cat /etc/haproxy/haproxy.cfg

listen neutron
  bind 10.0.0.122:9696 transparent      <--- External network
  bind 172.17.1.48:9696 transparent     <--- InternalApi network
  mode http
  http-request set-header X-Forwarded-Proto https if { ssl_fc }
  http-request set-header X-Forwarded-Proto http if !{ ssl_fc }
  http-request set-header X-Forwarded-Port %[dst_port]
  option httpchk
  option httplog
# Now the backends in the InternalApi network
  server controller-0.internalapi.local 172.17.1.72:9696 check fall 5 inter 2000 rise 2
  server controller-1.internalapi.local 172.17.1.101:9696 check fall 5 inter 2000 rise 2
  server controller-2.internalapi.local 172.17.1.115:9696 check fall 5 inter 2000 rise 2

In the above output, the IP address 172.17.1.48 is a virtual IP managed by pacemaker and will live in the InternalApi (VLAN 20) network where it is master:

[root@controller-1 ~]# pcs status | grep 172.17.1.48
  * ip-172.17.1.48      (ocf::heartbeat:IPaddr2):       Started controller-0

[root@controller-0 ~]# ip a |grep 172.17.1.48
    inet 172.17.1.48/32 brd 172.17.1.255 scope global vlan20

Traffic inspection

With a clear view on the networking layout, now we can use the hypervisor to hook a tcpdump in the right bridge and check for whatever traffic we’re interested in.

Let’s for example ping from the InternalApi (172.17.1.0/24) network on controller-0 to controller-1 and check the traffic in the hypervisor:

[heat-admin@controller-0 ~]$ ping controller-1.internalapi.local
PING controller-1.internalapi.redhat.local (172.17.1.101) 56(84) bytes of data.
64 bytes from controller-1.redhat.local (172.17.1.101): icmp_seq=1 ttl=64 time=0.213 ms
64 bytes from controller-1.redhat.local (172.17.1.101): icmp_seq=2 ttl=64 time=0.096 ms


[root@hypervisor]# tcpdump -i management -vvne icmp -c2
tcpdump: listening on management, link-type EN10MB (Ethernet), capture size 262144 bytes
15:19:08.418046 52:54:00:74:29:4f > 52:54:00:0b:ad:3b, ethertype 802.1Q (0x8100), length 102: vlan 20, p 0, ethertype IPv4, (tos 0x0, ttl 64, id 58494, offset 0, flags [DF], proto ICMP (1), length 84)
172.17.1.72 > 172.17.1.101: ICMP echo request, id 53086, seq 5, length 64 15:19:08.418155 52:54:00:0b:ad:3b > 52:54:00:74:29:4f, ethertype 802.1Q (0x8100), length 102: vlan 20, p 0, ethertype IPv4, (tos 0x0, ttl 64, id 39897, offset 0, flags [none], proto ICMP (1), length 84) 172.17.1.101 > 172.17.1.72: ICMP echo reply, id 53086, seq 5, length 64 [root@hypervisor]# brctl showmacs management | egrep "52:54:00:0b:ad:3b|52:54:00:74:29:4f" port no mac addr is local? ageing timer 3 52:54:00:0b:ad:3b no 0.01 5 52:54:00:74:29:4f no 0.01

When we ping to the controller-1 IP address of the InternalApi network, the traffic is tagged (VLAN 20) and going through the management bridge in the hypervisor. This matches our expectations as we defined such network in the template files that way.

Similarly, we could trace more complicated scenarios like an OpenStack instance in a tenant network pinging an external destination:

(overcloud) [stack@undercloud-0 ~]$ openstack server list
+--------------------------------------+---------+--------+-----------------------+--------+
| ID | Name | Status | Networks | Image |
+--------------------------------------+---------+--------+-----------------------+--------+
| 3d9f6957-5311-4590-8c62-097b576ffa04 | cirros1 | ACTIVE | private=192.168.0.166 | cirros |
+--------------------------------------+---------+--------+-----------------------+--------+
[root@compute-0 ~]# sudo ip net e ovnmeta-e49cc182-247c-4dc9-9589-4df6fcb09511 ssh cirros@192.168.0.166 cirros@192.168.0.166's password: $ ping 8.8.8.8 PING 8.8.8.8 (8.8.8.8): 56 data bytes 64 bytes from 8.8.8.8: seq=0 ttl=53 time=10.356 ms 64 bytes from 8.8.8.8: seq=1 ttl=53 time=8.591 ms

Now in the hypervisor, we’ll trace the Geneve traffic (VLAN50):

# tcpdump -i data -vvnne vlan 50 and "(udp port 6081) and (udp[10:2] = 0x6558) and (udp[(8 + (4 * (2 + (udp[8:1] & 0x3f))) + 12):2] = 0x0800) and (udp[8 + (4 * (2 + (udp[8:1] & 0x3f))) + 14 + 9:1] = 01)"  -c2

tcpdump: listening on data, link-type EN10MB (Ethernet), capture size 262144 bytes
16:21:28.642671 6a:9b:72:22:3f:68 > 0e:d0:eb:00:1b:e7, ethertype 802.1Q (0x8100), length 160: vlan 50, p 0, ethertype IPv4, (tos 0x0, ttl 64, id 15872, offset 0, flags [DF], proto UDP (17), length 142) 172.17.2.119.27073 > 172.17.2.143.6081: [bad udp cksum 0x5db4 -> 0x1e8c!] Geneve, Flags [C], vni 0x5, proto TEB (0x6558), options [class Open Virtual Networking (OVN) (0x102) type 0x80(C) len 8 data 00010003] fa:16:3e:a7:95:87 > 52:54:00:0c:eb:7c, ethertype IPv4 (0x0800), length 98: (tos 0x0, ttl 63, id 50335, offset 0, flags [DF], proto ICMP (1), length 84) 192.168.0.166 > 8.8.8.8: ICMP echo request, id 2818, seq 2145, length 64 16:21:28.650412 0e:d0:eb:00:1b:e7 > 6a:9b:72:22:3f:68, ethertype 802.1Q (0x8100), length 160: vlan 50, p 0, ethertype IPv4, (tos 0x0, ttl 64, id 26871, offset 0, flags [DF], proto UDP (17), length 142) 172.17.2.143.31003 > 172.17.2.119.6081: [bad udp cksum 0x5db4 -> 0x4a04!] Geneve, Flags [C], vni 0x3, proto TEB (0x6558), options [class Open Virtual Networking (OVN) (0x102) type 0x80(C) len 8 data 00040002] fa:16:3e:34:a2:0e > fa:16:3e:63:c0:7a, ethertype IPv4 (0x0800), length 98: (tos 0x0, ttl 53, id 0, offset 0, flags [none], proto ICMP (1), length 84) 8.8.8.8 > 192.168.0.166: ICMP echo reply, id 2818, seq 2145, length 64

(First, sorry for the complicated filter; I picked it up from here and adapted it to match on the inner protocol of the Geneve traffic against ICMP. If there’s an easier way please tell me :p)

We can see that the Geneve traffic goes between 6a:9b:72:22:3f:68 and 0e:d0:eb:00:1b:e7 and now we can determine the source/dest nodes:

[root@hypervisor]# brctl showmacs data
  2     6a:9b:72:22:3f:68       no                 0.32
  2     fe:54:00:c7:74:4b       yes                0.00
  2     fe:54:00:c7:74:4b       yes                0.00
  3     0e:d0:eb:00:1b:e7       no                 0.40
  3     fe:54:00:2f:9f:3e       yes                0.00
  3     fe:54:00:2f:9f:3e       yes                0.00

From the info above we can see that port 2 corresponds to the MAC ending in “74:4b” and port 3 corresponds to the MAC ending in “9f:3e“. Therefore, this Geneve traffic is flowing from the compute-0 node to the controller-1 node which is where Neutron is running the gateway to do the SNAT towards the external network. Now, this last portion can be examined in the external bridge:

[root@hypervisor]# tcpdump -i external icmp -vvnnee -c2
tcpdump: listening on external, link-type EN10MB (Ethernet), capture size 262144 bytes
16:33:35.016198 fa:16:3e:a7:95:87 > 52:54:00:0c:eb:7c, ethertype IPv4 (0x0800), length 98: (tos 0x0, ttl 63, id 13537, offset 0, flags [DF], proto ICMP (1), length 84) 10.0.0.225 > 8.8.8.8: ICMP echo request, id 4354, seq 556, length 64 16:33:35.023570 52:54:00:0c:eb:7c > fa:16:3e:a7:95:87, ethertype IPv4 (0x0800), length 98: (tos 0x0, ttl 54, id 0, offset 0, flags [none], proto ICMP (1), length 84) 8.8.8.8 > 10.0.0.225: ICMP echo reply, id 4354, seq 556, length 64

In case that you’re wondering what’s 10.0.0.225; that’s the IP address of the Neutron gateway:

(overcloud) [stack@undercloud-0 ~]$ openstack router show router1 | grep gateway
| external_gateway_info   | {"network_id": "fe8330fe-540a-4acf-bda8-394398fb4272", "external_fixed_ips": [{"subnet_id": "e388a080-1953-4cdd-9e35-48d416fe2ae1", "ip_address": "10.0.0.225"}

Similarly, the MAC addresses can be matched to confirm that the traffic goes from the gateway node (controller-1), as the MAC ending in “a5:ed”  – in the same port as the source MAC from the ICMP packet – corresponds to the NIC attached to the external network on the controller-1.

[root@hypervisor]# brctl showmacs external
  3     fa:16:3e:a7:95:87       no                 0.47
  3     fe:54:00:75:a5:ed       yes                0.00
  3     fe:54:00:75:a5:ed       yes                0.00

Reflection

This is a virtual setup and everything is confined to the boundaries of a physical server. However, it is a great playground to get yourself familiar with the underlay networking of an OpenStack setup (and networking in general ;). Once you get your hands on a real production environment, all these Linux bridges will be replaced by ToR switches (or even routers on a pure L3 Spine & Leaf architecture) but the fundamentals are the same.

OVN: Where is my packet?

Working with rather complex OpenFlow pipelines as in the case of OVN can be tricky when it comes to debugging. Being able to tell where a packet gets dropped may not be the easiest task ever but fortunately, this is getting a bit more friendly thanks to the available tools around OVS and OVN these days.

In this post, I’ll show a recent troubleshooting process that I did where the symptom was that an ICMP Neighbor Advertisement packet sent out by a guest VM was not arriving at its destination. It turned out to be a bug in ovn-controller that has already been fixed so it will hopefully illustrate some of the available tools and techniques to debug OVN through a real world example.

Let’s start by showing a failing ping to an OVN destination and we’ll build up from here:

# ping 2001:db8::f816:3eff:fe1e:5a0f -c2
PING 2001:db8::f816:3eff:fe1e:5a0f(2001:db8::f816:3eff:fe1e:5a0f) 56 data bytes
From f00d:f00d:f00d:f00d:f00d:f00d:f00d:9: icmp_seq=1 Destination unreachable: Address unreachable
From f00d:f00d:f00d:f00d:f00d:f00d:f00d:9: icmp_seq=2 Destination unreachable: Address unreachable

--- 2001:db8::f816:3eff:fe1e:5a0f ping statistics ---
2 packets transmitted, 0 received, +2 errors, 100% packet loss, time 61ms

In the destination hypervisor we can see the Neighbor Solicitation packets but no answer to them:

$ tcpdump -i br-ex -ne "icmp6" -c2

13:11:18.350789 b6:c9:b9:6e:50:48 > 33:33:ff:1e:5a:0f, ethertype IPv6 (0x86dd), length 86: fe80::b4c9:b9ff:fe6e:5048 > ff02::1:ff1e:5a0f: ICMP6, neighbor solicitation, who has 2001:db8::f816:3eff:fe1e:5a0f, length 32

13:11:19.378648 b6:c9:b9:6e:50:48 > 33:33:ff:1e:5a:0f, ethertype IPv6 (0x86dd), length 86: fe80::b4c9:b9ff:fe6e:5048 > ff02::1:ff1e:5a0f: ICMP6, neighbor solicitation, who has 2001:db8::f816:3eff:fe1e:5a0f, length 32

The first step is to determine whether the actual VM is responding with Neighbor Advertisement packets by examining the traffic on the tap interface:

$ tcpdump -veni tapdf8a80f8-0c icmp6 -c2

15:10:26.862344 b6:c9:b9:6e:50:48 > 33:33:ff:1e:5a:0f, ethertype IPv6 (0x86dd), length 86: (hlim 255, next-header ICMPv6 (58) payload length: 32) fe80::b4c9:b9ff:fe6e:5048 > ff02::1:ff1e:5a0f: [icmp6 sum ok] ICMP6, neighbor solicitation, length 32, who has 2001:db8::f816:3eff:fe1e:5a0f
          source link-address option (1), length 8 (1): b6:c9:b9:6e:50:48

15:10:26.865489 fa:16:3e:1e:5a:0f > b6:c9:b9:6e:50:48, ethertype IPv6 (0x86dd), length 86: (hlim 255, next-header ICMPv6 (58) payload length: 32) 2001:db8::f816:3eff:fe1e:5a0f > fe80::b4c9:b9ff:fe6e:5048: [icmp6 sum ok] ICMP6, neighbor advertisement, length 32, tgt is 2001:db8::f816:3eff:fe1e:5a0f, Flags [solicited, override]
          destination link-address option (2), length 8 (1): fa:16:3e:1e:5a:0f

At this point we know that the Neighbor Advertisement (NA) packets are sent by the VM but dropped somewhere in the OVN integration bridge, which makes this task about inspecting Logical and Physical flows to find out what’s causing this.

Let’s begin by checking the Logical flows to see if, from the OVN database standpoint, all is correctly configured. For this, we need to collect all the info that we are going to pass to the ovn-trace tool to simulate the NA packet originated from the VM such as:

  • datapath: OVN Logical Switch name or ID
  • inport: OVN port name corresponding to the VM
  • eth.src & eth.dst: source and destination MAC addresses (we can copy them from the tcpdump output above)
  • ip6.src: the IPv6 address of the VM
  • nd_target: The IPv6 address that is advertised
# ovn-nbctl show
[...]
switch 0309ffff-7c89-427e-a68e-cd87b0658005 (neutron-aab27d39-a3c0-4666-81a0-aa4be26ec873) (aka provider-flat)
    port provnet-64e303a9-af62-4833-b713-6b361cdd6ecd
        type: localnet
        addresses: ["unknown"]
    port 916eb7ea-4d64-4d9c-be28-b693af2e7ed3
        type: localport
        addresses: ["fa:16:3e:65:76:bd 172.24.100.2 2001:db8::f816:3eff:fe65:76bd"]
    port df8a80f8-0cbf-48af-8b32-78377f034797 (aka vm-provider-flat-port)
        addresses: ["fa:16:3e:1e:5a:0f 2001:db8::f816:3eff:fe1e:5a0f"]
    port f1d49ca3-0e9c-4387-8d5d-c833fc3b7943
        type: router
        router-port: lrp-f1d49ca3-0e9c-4387-8d5d-c833fc3b7943

With all this info we are ready to run ovn-trace:

$ ovn-trace --summary neutron-aab27d39-a3c0-4666-81a0-aa4be26ec873 'inport == "df8a80f8-0cbf-48af-8b32-78377f034797" && eth.src == fa:16:3e:1e:5a:0f && eth.dst == b6:c9:b9:6e:50:48 && ip6.src == 2001:db8::f816:3eff:fe1e:5a0f  && nd.target == 2001:db8::f816:3eff:fe1e:5a0f && nd_na && nd.tll == fa:16:3e:1e:5a:0f'
# icmp6,reg14=0x4,vlan_tci=0x0000,dl_src=fa:16:3e:1e:5a:0f,dl_dst=b6:c9:b9:6e:50:48,ipv6_src=2001:db8::f816:3eff:fe1e:5a0f,ipv6_dst=::,ipv6_label=0x00000,nw_tos=0,nw_ecn=0,nw_ttl=255,icmp_type=136,icmp_code=0,nd_target=2001:db8::f816:3eff:fe1e:5a0f,nd_sll=00:00:00:00:00:00,nd_tll=fa:16:3e:1e:5a:0f
ingress(dp="provider-flat", inport="vm-provider-flat-port") {
    next;
    next;
    next;
    next;
    next;
    reg0[8] = 1;
    reg0[9] = 1;
    next;
    next;
    outport = "_MC_unknown";
    output;
    multicast(dp="provider-flat", mcgroup="_MC_unknown") {
        egress(dp="provider-flat", inport="vm-provider-flat-port", outport="provnet-64e303") {
            next;
            next;
            reg0[8] = 1;
            reg0[9] = 1;
            next;
            next;
            output;
            /* output to "provnet-64e303", type "localnet" */;
        };
    };
};

As we can see from the ovn-trace output above, the packet should be delivered to the localnet port as per the OVN DB contents, meaning that we should have been able to see it with tcpdump. Since we know that the packet was not present in the bridge, the next step is to figure out where it is being dropped in the OpenFlow pipeline by inspecting the Physical flows.

First, let’s capture a live packet (filter by ICMP6 and Neighbor Advertisement):

$ flow=$(tcpdump -nXXi tapdf8a80f8-0c "icmp6 && ip6[40] = 136 && host 2001:db8::f816:3eff:fe1e:5a0f"  -c1 | ovs-tcpundump)

1 packet captured
1 packet received by filter
0 packets dropped by kernel

$ echo $flow
b6c9b96e5048fa163e1e5a0f86dd6000000000203aff20010db800000000f8163efffe1e5a0ffe80000000000000b4c9b9fffe6e504888004d626000000020010db800000000f8163efffe1e5a0f0201fa163e1e5a0f

Now, let’s feed this packet into ovs-appctl to see the execution of the OVS pipeline:

$ ovs-appctl ofproto/trace br-int in_port=`ovs-vsctl get Interface tapdf8a80f8-0c ofport` $flow

Flow: icmp6,in_port=9,vlan_tci=0x0000,dl_src=fa:16:3e:1e:5a:0f,dl_dst=b6:c9:b9:6e:50:48,ipv6_src=2001:db8::f816:3eff:fe1e:5a0f,ipv6_dst=fe80::b4c9:b9ff:fe6e:5048,ipv6_label=0x00000,nw_tos=0,nw_ecn=0,nw_ttl=255,icmp_type=136,icmp_code=0,nd_target=2001:db8::f816:3eff:fe1e:5a0f,nd_sll=00:00:00:00:00:00,nd_tll=fa:16:3e:1e:5a:0f

bridge("br-int")
----------------
 0. in_port=9, priority 100, cookie 0x146e7f9c
    set_field:0x1->reg13
    set_field:0x3->reg11
    set_field:0x2->reg12
    set_field:0x7->metadata
    set_field:0x4->reg14
    resubmit(,8)
 8. reg14=0x4,metadata=0x7,dl_src=fa:16:3e:1e:5a:0f, priority 50, cookie 0x195ddd1b
    resubmit(,9)
 9. ipv6,reg14=0x4,metadata=0x7,dl_src=fa:16:3e:1e:5a:0f,ipv6_src=2001:db8::f816:3eff:fe1e:5a0f, priority 90, cookie 0x1c05660e
    resubmit(,10)
10. icmp6,reg14=0x4,metadata=0x7,nw_ttl=255,icmp_type=136,icmp_code=0, priority 80, cookie 0xd3c58704
    drop

Final flow: icmp6,reg11=0x3,reg12=0x2,reg13=0x1,reg14=0x4,metadata=0x7,in_port=9,vlan_tci=0x0000,dl_src=fa:16:3e:1e:5a:0f,dl_dst=b6:c9:b9:6e:50:48,ipv6_src=2001:db8::f816:3eff:fe1e:5a0f,ipv6_dst=fe80::b4c9:b9ff:fe6e:5048,ipv6_label=0x00000,nw_tos=0,nw_ecn=0,nw_ttl=255,icmp_type=136,icmp_code=0,nd_target=2001:db8::f816:3eff:fe1e:5a0f,nd_sll=00:00:00:00:00:00,nd_tll=fa:16:3e:1e:5a:0f
Megaflow: recirc_id=0,eth,icmp6,in_port=9,dl_src=fa:16:3e:1e:5a:0f,ipv6_src=2001:db8::f816:3eff:fe1e:5a0f,ipv6_dst=fe80::/16,nw_ttl=255,nw_frag=no,icmp_type=0x88/0xff,icmp_code=0x0/0xff,nd_target=2001:db8::f816:3eff:fe1e:5a0f,nd_sll=00:00:00:00:00:00,nd_tll=fa:16:3e:1e:5a:0f

We see that the packet is dropped in the table 10. Also, we can feed this output into ovn-detrace for a more friendly output which allows us to match each OpenFlow rule to OVN logical flows and tables:

$ ovs-appctl ofproto/trace br-int in_port=9 $flow | ovn-detrace --ovnsb="tcp:99.88.88.88:6642" --ovnnb="tcp:99.88.88.88:6641"

Flow: icmp6,in_port=9,vlan_tci=0x0000,dl_src=fa:16:3e:1e:5a:0f,dl_dst=b6:c9:b9:6e:50:48,ipv6_src=2001:db8::f816:3eff:fe1e:5a0f,ipv6_dst=fe80::b4c9:b9ff:fe6e:5048,ipv6_label=0x00000,nw_tos=0,nw_ecn=0,nw_ttl=255,icmp_type=136,icmp_code=0,nd_target=2001:db8::f816:3eff:fe1e:5a0f,nd_sll=00:00:00:00:00:00,nd_tll=fa:16:3e:1e:5a:0f

bridge("br-int")
----------------
0. in_port=9, priority 100, cookie 0x146e7f9c
set_field:0x1->reg13
set_field:0x3->reg11
set_field:0x2->reg12
set_field:0x7->metadata
set_field:0x4->reg14
resubmit(,8)
  *  Logical datapath: "neutron-aab27d39-a3c0-4666-81a0-aa4be26ec873" (67b33068-8baa-4e45-9447-61352f8d5204)
  *  Port Binding: logical_port "df8a80f8-0cbf-48af-8b32-78377f034797", tunnel_key 4, chassis-name "4bcf0b65-8d0c-4dde-9783-7ccb23fe3627", chassis-str "cmp-3-1.bgp.ftw"
8. reg14=0x4,metadata=0x7,dl_src=fa:16:3e:1e:5a:0f, priority 50, cookie 0x195ddd1b
resubmit(,9)
  *  Logical datapaths:
  *      "neutron-aab27d39-a3c0-4666-81a0-aa4be26ec873" (67b33068-8baa-4e45-9447-61352f8d5204) [ingress]
  *  Logical flow: table=0 (ls_in_port_sec_l2), priority=50, match=(inport == "df8a80f8-0cbf-48af-8b32-78377f034797" && eth.src == {fa:16:3e:1e:5a:0f}), actions=(next;)
   *  Logical Switch Port: df8a80f8-0cbf-48af-8b32-78377f034797 type  (addresses ['fa:16:3e:1e:5a:0f 172.24.100.163 2001:db8::f816:3eff:fe1e:5a0f'], dynamic addresses [], security ['fa:16:3e:1e:5a:0f 172.24.100.163 2001:db8::f816:3eff:fe1e:5a0f']
9. ipv6,reg14=0x4,metadata=0x7,dl_src=fa:16:3e:1e:5a:0f,ipv6_src=2001:db8::f816:3eff:fe1e:5a0f, priority 90, cookie 0x1c05660e
resubmit(,10)
  *  Logical datapaths:
  *      "neutron-aab27d39-a3c0-4666-81a0-aa4be26ec873" (67b33068-8baa-4e45-9447-61352f8d5204) [ingress]
  *  Logical flow: table=1 (ls_in_port_sec_ip), priority=90, match=(inport == "df8a80f8-0cbf-48af-8b32-78377f034797" && eth.src == fa:16:3e:1e:5a:0f && ip6.src == {fe80::f816:3eff:fe1e:5a0f, 2001:db8::f816:3eff:fe1e:5a0f}), actions=(next;)
   *  Logical Switch Port: df8a80f8-0cbf-48af-8b32-78377f034797 type  (addresses ['fa:16:3e:1e:5a:0f 172.24.100.163 2001:db8::f816:3eff:fe1e:5a0f'], dynamic addresses [], security ['fa:16:3e:1e:5a:0f 172.24.100.163 2001:db8::f816:3eff:fe1e:5a0f']
10. icmp6,reg14=0x4,metadata=0x7,nw_ttl=255,icmp_type=136,icmp_code=0, priority 80, cookie 0xd3c58704
drop
  *  Logical datapaths:
  *      "neutron-aab27d39-a3c0-4666-81a0-aa4be26ec873" (67b33068-8baa-4e45-9447-61352f8d5204) [ingress]
  *  Logical flow: table=2 (ls_in_port_sec_nd), priority=80, match=(inport == "df8a80f8-0cbf-48af-8b32-78377f034797" && (arp || nd)), actions=(drop;)
   *  Logical Switch Port: df8a80f8-0cbf-48af-8b32-78377f034797 type  (addresses ['fa:16:3e:1e:5a:0f 172.24.100.163 2001:db8::f816:3eff:fe1e:5a0f'], dynamic addresses [], security ['fa:16:3e:1e:5a:0f 172.24.100.163 2001:db8::f816:3eff:fe1e:5a0f']

Final flow: icmp6,reg11=0x3,reg12=0x2,reg13=0x1,reg14=0x4,metadata=0x7,in_port=9,vlan_tci=0x0000,dl_src=fa:16:3e:1e:5a:0f,dl_dst=b6:c9:b9:6e:50:48,ipv6_src=2001:db8::f816:3eff:fe1e:5a0f,ipv6_dst=fe80::b4c9:b9ff:fe6e:5048,ipv6_label=0x00000,nw_tos=0,nw_ecn=0,nw_ttl=255,icmp_type=136,icmp_code=0,nd_target=2001:db8::f816:3eff:fe1e:5a0f,nd_sll=00:00:00:00:00:00,nd_tll=fa:16:3e:1e:5a:0f
Megaflow: recirc_id=0,eth,icmp6,in_port=9,dl_src=fa:16:3e:1e:5a:0f,ipv6_src=2001:db8::f816:3eff:fe1e:5a0f,ipv6_dst=fe80::/16,nw_ttl=255,nw_frag=no,icmp_type=0x88/0xff,icmp_code=0x0/0xff,nd_target=2001:db8::f816:3eff:fe1e:5a0f,nd_sll=00:00:00:00:00:00,nd_tll=fa:16:3e:1e:5a:0f
Datapath actions: drop

The packet is explicitly dropped in table 10 (OVN Logical Switch table 2 (ls_in_port_sec_nd) because no other higher priority flow in that table was matched previously. Let’s inspect the relevant OVN Logical flows in such table:

_uuid               : e58f66b6-07f0-4f31-bd6b-97ea609ac3fb
actions             : "next;"
external_ids        : {source="ovn-northd.c:4455", stage-hint=bc1dbbdf, stage-name=ls_in_port_sec_nd}
logical_datapath    : 67b33068-8baa-4e45-9447-61352f8d5204
logical_dp_group    : []
match               : "inport == \"df8a80f8-0cbf-48af-8b32-78377f034797\" && eth.src == fa:16:3e:1e:5a:0f && ip6 && nd && ((nd.sll == 00:00:00:00:00:00 || nd.sll == fa:16:3e:1e:5a:0f) || ((nd.tll == 00:00:00:00:00:00 || nd.tll == fa:16:3e:1e:5a:0f) && (nd.target == fe80::f816:3eff:fe1e:5a0f || nd.target == 2001:db8::f816:3eff:fe1e:5a0f)))"
pipeline            : ingress
priority            : 90
table_id            : 2


_uuid               : d3c58704-c6be-4876-b023-2ec7ae870bde
actions             : "drop;"
external_ids        : {source="ovn-northd.c:4462", stage-hint=bc1dbbdf, stage-name=ls_in_port_sec_nd}
logical_datapath    : 67b33068-8baa-4e45-9447-61352f8d5204
logical_dp_group    : []
match               : "inport == \"df8a80f8-0cbf-48af-8b32-78377f034797\" && (arp || nd)"
pipeline            : ingress
priority            : 80
table_id            : 2

The first flow above should have matched, it has higher priority than the drop and all the fields seem correct. Let’s take a look at the actual OpenFlow rules installed by ovn-controller matching on some fields of the logical flow such as the uuid/cookie or the nd_target: 

$ ovs-ofctl dump-flows br-int |grep cookie=0xe58f66b6 | grep icmp_type=136
 cookie=0xe58f66b6, duration=20946.048s, table=10, n_packets=0, n_bytes=0, idle_age=20946, priority=90,conj_id=19,icmp6,reg14=0x4,metadata=0x7,dl_src=fa:16:3e:1e:5a:0f,nw_ttl=255,icmp_type=136,icmp_code=0 actions=resubmit(,11)

$ ovs-ofctl dump-flows br-int table=10 | grep priority=90 | grep nd_target=2001:db8::f816:3eff:fe1e:5a0f
 cookie=0x0, duration=21035.890s, table=10, n_packets=0, n_bytes=0, idle_age=21035, priority=90,icmp6,reg14=0x4,metadata=0x7,dl_src=fa:16:3e:1e:5a:0f,nw_ttl=255,icmp_type=136,icmp_code=0,nd_target=2001:db8::f816:3eff:fe1e:5a0f actions=conjunction(3,1/2)

At first glance, the fact that the packet counter is 0 when all the fields seem correct (src/dest IP addresses, ICMP6 type, …) looks suspicious. The conjunctive flows are key here. On one hand, the first flow is referencing conj_id=19 while the second flow is referencing conj_id=3 (the notation for conjunction(3,1/2) means that the action to be executed is the first out of 2 clauses for the conjunction id 3). However, there’s no such conjunction and hence, the packet will not hit these flows:

$ ovs-ofctl dump-flows br-int | grep conj_id=3 -c
0

If our assumptions are correct, we could rewrite the first flow so that the conjunction id matches the expected value (3). For this, we’ll stop first ovn-controller, delete the flow and add the new one:

$ ovs-ofctl del-flows --strict br-int table=10,priority=90,conj_id=19,icmp6,reg14=0x4,metadata=0x7,dl_src=fa:16:3e:1e:5a:0f,nw_ttl=255,icmp_type=136,icmp_code=0

$ ovs-ofctl add-flow br-int "cookie=0xe58f66b6,table=10,priority=90,conj_id=3,icmp6,reg14=0x4,metadata=0x7,dl_src=fa:16:3e:1e:5a:0f,nw_ttl=255,icmp_type=136,icmp_code=0,actions=resubmit(,11)"

At this point we can test the ping and see if it works and the new flow gets hit:

$ tcpdump -ni tapdf8a80f8-0c

11:00:24.975037 IP6 fe80::b4c9:b9ff:fe6e:5048 > 2001:db8::f816:3eff:fe1e:5a0f: ICMP6, neighbor solicitation, who has 2001:db8::f816:3eff:fe1e:5a0f, length 32

11:00:24.975544 IP6 2001:db8::f816:3eff:fe1e:5a0f > fe80::b4c9:b9ff:fe6e:5048: ICMP6, neighbor advertisement, tgt is 2001:db8::f816:3eff:fe1e:5a0f, length 24

11:00:25.831695 IP6 f00d:f00d:f00d:4::1 > 2001:db8::f816:3eff:fe1e:5a0f: ICMP6, echo request, seq 55, length 64

11:00:25.832182 IP6 2001:db8::f816:3eff:fe1e:5a0f > f00d:f00d:f00d:4::1: ICMP6, echo reply, seq 55, length 64

$ sudo ovs-ofctl dump-flows br-int| grep cookie=0xe58f66b6  | grep conj_id

 cookie=0xe58f66b6, duration=5.278s, table=10, n_packets=2, n_bytes=172, idle_age=4, priority=90,conj_id=3,icmp6,reg14=0x4,metadata=0x7,dl_src=fa:16:3e:1e:5a:0f,nw_ttl=255,icmp_type=136,icmp_code=0 actions=resubmit(,11)

As I mentioned earlier, this issue is now solved upstream and you can check the fix here. With this patch, the conjunction ids will be properly generated and we’ll no longer hit this bug. 

Most of the issues that we’ll face in OVN will be likely related to misconfigurations (missing ACLs, port security, …) and the use of tools like ovn-trace will help us spot them. However, when tackling legitimate bugs in the core OVN side, there’s no easy and defined way to find them but luckily we have some tools at hand that, at the very least, will help us providing a good bug report that will be promptly picked and solved by the very active OVN community. 

OVN Cluster Interconnection

A new feature has been recently introduced in OVN that allows multiple clusters to be interconnected at L3 level (here’s a link to the series of patches). This can be useful for scenarios with multiple availability zones (or physical regions) or simply to allow better scaling by having independent control planes yet allowing connectivity between workloads in separate zones.

Simplifying things, logical routers on each cluster can be connected via transit overlay networks. The interconnection layer is responsible for creating the transit switches in the IC database that will become visible to the connected clusters. Each cluster can then connect their logical routers to the transit switches. More information can be found in the ovn-architecture manpage.

I created a vagrant setup to test it out and become a bit familiar with it. All you need to do to recreate it is cloning and running ‘vagrant up‘ inside the ovn-interconnection folder:

https://github.com/danalsan/vagrants/tree/master/ovn-interconnection

This will deploy 7 CentOS machines (300MB of RAM each) with two separate OVN clusters (west & east) and the interconnection services. The layout is described in the image below:

Once the services are up and running, a few resources will be created on each cluster and the interconnection services will be configured with a transit switch between them:

Let’s see, for example, the logical topology of the east availability zone, where the transit switch ts1 is listed along with the port in the west remote zone:

[root@central-east ~]# ovn-nbctl show
switch c850599c-263c-431b-b67f-13f4eab7a2d1 (ts1)
    port lsp-ts1-router_west
        type: remote
        addresses: ["aa:aa:aa:aa:aa:02 169.254.100.2/24"]
    port lsp-ts1-router_east
        type: router
        router-port: lrp-router_east-ts1
switch 8361d0e1-b23e-40a6-bd78-ea79b5717d7b (net_east)
    port net_east-router_east
        type: router
        router-port: router_east-net_east
    port vm1
        addresses: ["40:44:00:00:00:01 192.168.1.11"]
router b27d180d-669c-4ca8-ac95-82a822da2730 (router_east)
    port lrp-router_east-ts1
        mac: "aa:aa:aa:aa:aa:01"
        networks: ["169.254.100.1/24"]
        gateway chassis: [gw_east]
    port router_east-net_east
        mac: "40:44:00:00:00:04"
        networks: ["192.168.1.1/24"]

As for the Southbound database, we can see the gateway port for each router. In this setup I only have one gateway node but, as any other distributed gateway port in OVN, it could be scheduled in multiple nodes providing HA

[root@central-east ~]# ovn-sbctl show
Chassis worker_east
    hostname: worker-east
    Encap geneve
        ip: "192.168.50.100"
        options: {csum="true"}
    Port_Binding vm1
Chassis gw_east
    hostname: gw-east
    Encap geneve
        ip: "192.168.50.102"
        options: {csum="true"}
    Port_Binding cr-lrp-router_east-ts1
Chassis gw_west
    hostname: gw-west
    Encap geneve
        ip: "192.168.50.103"
        options: {csum="true"}
    Port_Binding lsp-ts1-router_west

If we query the interconnection databases, we will see the transit switch in the NB and the gateway ports in each zone:

[root@central-ic ~]# ovn-ic-nbctl show
Transit_Switch ts1

[root@central-ic ~]# ovn-ic-sbctl show
availability-zone east
    gateway gw_east
        hostname: gw-east
        type: geneve
            ip: 192.168.50.102
        port lsp-ts1-router_east
            transit switch: ts1
            address: ["aa:aa:aa:aa:aa:01 169.254.100.1/24"]
availability-zone west
    gateway gw_west
        hostname: gw-west
        type: geneve
            ip: 192.168.50.103
        port lsp-ts1-router_west
            transit switch: ts1
            address: ["aa:aa:aa:aa:aa:02 169.254.100.2/24"]

With this topology, traffic flowing from vm1 to vm2 shall flow from gw-east to gw-west through a Geneve tunnel. If we list the ports in each gateway we should be able to see the tunnel ports. Needless to say, gateways have to be mutually reachable so that the transit overlay network can be established:

[root@gw-west ~]# ovs-vsctl show
6386b867-a3c2-4888-8709-dacd6e2a7ea5
    Bridge br-int
        fail_mode: secure
        Port ovn-gw_eas-0
            Interface ovn-gw_eas-0
                type: geneve
                options: {csum="true", key=flow, remote_ip="192.168.50.102"}

Now, when vm1 pings vm2, the traffic flow should be like:

(vm1) worker_east ==== gw_east ==== gw_west ==== worker_west (vm2).

Let’s see it via ovn-trace tool:

[root@central-east vagrant]# ovn-trace  --ovs --friendly-names --ct=new net_east  'inport == "vm1" && eth.src == 40:44:00:00:00:01 && eth.dst == 40:44:00:00:00:04 && ip4.src == 192.168.1.11 && ip4.dst == 192.168.2.12 && ip.ttl == 64 && icmp4.type == 8'


ingress(dp="net_east", inport="vm1")
...
egress(dp="net_east", inport="vm1", outport="net_east-router_east")
...
ingress(dp="router_east", inport="router_east-net_east")
...
egress(dp="router_east", inport="router_east-net_east", outport="lrp-router_east-ts1")
...
ingress(dp="ts1", inport="lsp-ts1-router_east")
...
egress(dp="ts1", inport="lsp-ts1-router_east", outport="lsp-ts1-router_west")
 9. ls_out_port_sec_l2 (ovn-northd.c:4543): outport == "lsp-ts1-router_west", priority 50, uuid c354da11
    output;
    /* output to "lsp-ts1-router_west", type "remote" */

Now let’s capture Geneve traffic on both gateways while a ping between both VMs is running:

[root@gw-east ~]# tcpdump -i genev_sys_6081 -vvnee icmp
tcpdump: listening on genev_sys_6081, link-type EN10MB (Ethernet), capture size 262144 bytes
10:43:35.355772 aa:aa:aa:aa:aa:01 > aa:aa:aa:aa:aa:02, ethertype IPv4 (0x0800), length 98: (tos 0x0, ttl 63, id 11379, offset 0, flags [DF], proto ICMP (1), length 84)
    192.168.1.11 > 192.168.2.12: ICMP echo request, id 5494, seq 40, length 64
10:43:35.356077 aa:aa:aa:aa:aa:01 > aa:aa:aa:aa:aa:02, ethertype IPv4 (0x0800), length 98: (tos 0x0, ttl 63, id 11379, offset 0, flags [DF], proto ICMP (1), length 84)
    192.168.1.11 > 192.168.2.12: ICMP echo request, id 5494, seq 40, length 64
10:43:35.356442 aa:aa:aa:aa:aa:02 > aa:aa:aa:aa:aa:01, ethertype IPv4 (0x0800), length 98: (tos 0x0, ttl 63, id 42610, offset 0, flags [none], proto ICMP (1), length 84)
    192.168.2.12 > 192.168.1.11: ICMP echo reply, id 5494, seq 40, length 64
10:43:35.356734 40:44:00:00:00:04 > 40:44:00:00:00:01, ethertype IPv4 (0x0800), length 98: (tos 0x0, ttl 62, id 42610, offset 0, flags [none], proto ICMP (1), length 84)
    192.168.2.12 > 192.168.1.11: ICMP echo reply, id 5494, seq 40, length 64


[root@gw-west ~]# tcpdump -i genev_sys_6081 -vvnee icmp
tcpdump: listening on genev_sys_6081, link-type EN10MB (Ethernet), capture size 262144 bytes
10:43:29.169532 aa:aa:aa:aa:aa:01 > aa:aa:aa:aa:aa:02, ethertype IPv4 (0x0800), length 98: (tos 0x0, ttl 63, id 8875, offset 0, flags [DF], proto ICMP (1), length 84)
    192.168.1.11 > 192.168.2.12: ICMP echo request, id 5494, seq 34, length 64
10:43:29.170058 40:44:00:00:00:10 > 40:44:00:00:00:02, ethertype IPv4 (0x0800), length 98: (tos 0x0, ttl 62, id 8875, offset 0, flags [DF], proto ICMP (1), length 84)
    192.168.1.11 > 192.168.2.12: ICMP echo request, id 5494, seq 34, length 64
10:43:29.170308 aa:aa:aa:aa:aa:02 > aa:aa:aa:aa:aa:01, ethertype IPv4 (0x0800), length 98: (tos 0x0, ttl 63, id 38667, offset 0, flags [none], proto ICMP (1), length 84)
    192.168.2.12 > 192.168.1.11: ICMP echo reply, id 5494, seq 34, length 64
10:43:29.170476 aa:aa:aa:aa:aa:02 > aa:aa:aa:aa:aa:01, ethertype IPv4 (0x0800), length 98: (tos 0x0, ttl 63, id 38667, offset 0, flags [none], proto ICMP (1), length 84)
    192.168.2.12 > 192.168.1.11: ICMP echo reply, id 5494, seq 34, length 64

You can observe that the ICMP traffic flows between the transit switch ports (aa:aa:aa:aa:aa:02 <> aa:aa:aa:aa:aa:01) traversing both zones.

Also, as the packet has gone through two routers (router_east and router_west), the TTL at the destination has been decremented twice (from 64 to 62):

[root@worker-west ~]# ip net e vm2 tcpdump -i any icmp -vvne
tcpdump: listening on any, link-type LINUX_SLL (Linux cooked), capture size 262144 bytes
10:49:32.491674  In 40:44:00:00:00:10 ethertype IPv4 (0x0800), length 100: (tos 0x0, ttl 62, id 57504, offset 0, flags [DF], proto ICMP (1), length 84)

This is a really great feature that opens a lot of possibilities for cluster interconnection and scaling. However, it has to be taken into account that it requires another layer of management that handles isolation (multitenancy) and avoids IP overlapping across the connected availability zones.

OVN Routing and ovn-trace

In the last post we covered how OVN distributes the pipeline execution across the different hypervisors thanks to the encapsulation used. Using the same system as a base, let’s create a Logical Router and a second Logical Switch where we can see how routing works between different nodes.


ovn-nbctl ls-add network1
ovn-nbctl ls-add network2
ovn-nbctl lsp-add network1 vm1
ovn-nbctl lsp-add network2 vm2
ovn-nbctl lsp-set-addresses vm1 "40:44:00:00:00:01 192.168.0.11"
ovn-nbctl lsp-set-addresses vm2 "40:44:00:00:00:02 192.168.1.11"

ovn-nbctl lr-add router1
ovn-nbctl lrp-add router1 router1-net1 40:44:00:00:00:03 192.168.0.1/24
ovn-nbctl lsp-add network1 net1-router1
ovn-nbctl lsp-set-addresses net1-router1 40:44:00:00:00:03
ovn-nbctl lsp-set-type net1-router1 router
ovn-nbctl lsp-set-options net1-router1 router-port=router1-net1

ovn-nbctl lrp-add router1 router1-net2 40:44:00:00:00:04 192.168.1.1/24
ovn-nbctl lsp-add network2 net2-router1
ovn-nbctl lsp-set-addresses net2-router1 40:44:00:00:00:04
ovn-nbctl lsp-set-type net2-router1 router
ovn-nbctl lsp-set-options net2-router1 router-port=router1-net2

And then on Worker1 and Worker2 respectively, let’s bind VM1 and VM2 ports inside network namespaces:

# Worker1
ovs-vsctl add-port br-int vm1 -- set Interface vm1 type=internal -- set Interface vm1 external_ids:iface-id=vm1
ip netns add vm1
ip link set vm1 netns vm1
ip netns exec vm1 ip link set vm1 address 40:44:00:00:00:01
ip netns exec vm1 ip addr add 192.168.0.11/24 dev vm1
ip netns exec vm1 ip link set vm1 up
ip netns exec vm1 ip route add default via 192.168.0.1

# Worker2
ovs-vsctl add-port br-int vm2 -- set Interface vm2 type=internal -- set Interface vm2 external_ids:iface-id=vm2
ip netns add vm2
ip link set vm2 netns vm2
ip netns exec vm2 ip link set vm2 address 40:44:00:00:00:02
ip netns exec vm2 ip addr add 192.168.1.11/24 dev vm2
ip netns exec vm2 ip link set vm2 up
ip netns exec vm2 ip route add default via 192.168.1.1

First, let’s check connectivity between two VMs through the Logical Router:

[root@worker1 ~]# ip netns exec vm1 ping 192.168.1.11 -c2
PING 192.168.1.11 (192.168.1.11) 56(84) bytes of data.
64 bytes from 192.168.1.11: icmp_seq=1 ttl=63 time=0.371 ms
64 bytes from 192.168.1.11: icmp_seq=2 ttl=63 time=0.398 ms

--- 192.168.1.11 ping statistics ---
2 packets transmitted, 2 received, 0% packet loss, time 1000ms
rtt min/avg/max/mdev = 0.371/0.384/0.398/0.023 ms

ovn-trace

Let’s now check with ovn-trace how the flow of a packet from VM1 to VM2 looks like and then we’ll verify how this gets realized in our physical deployment with 3 hypervisors: 

[root@central ~]# ovn-trace --summary network1 'inport == "vm1" && eth.src == 40:44:00:00:00:01 && eth.dst == 40:44:00:00:00:03 && ip4.src == 192.168.0.11 && ip4.dst == 192.168.1.11 && ip.ttl == 64'
# ip,reg14=0x1,vlan_tci=0x0000,dl_src=40:44:00:00:00:01,dl_dst=40:44:00:00:00:03,nw_src=192.168.0.11,nw_dst=192.168.1.11,nw_proto=0,nw_tos=0,nw_ecn=0,nw_ttl=64
ingress(dp="network1", inport="vm1") {
    next;
    outport = "net1-router1";
    output;
    egress(dp="network1", inport="vm1", outport="net1-router1") {
        output;
        /* output to "net1-router1", type "patch" */;
        ingress(dp="router1", inport="router1-net1") {
            next;
            ip.ttl--;
            reg0 = ip4.dst;
            reg1 = 192.168.1.1;
            eth.src = 40:44:00:00:00:04;
            outport = "router1-net2";
            flags.loopback = 1;
            next;
            eth.dst = 40:44:00:00:00:02;
            next;
            output;
            egress(dp="router1", inport="router1-net1", outport="router1-net2") {
                output;
                /* output to "router1-net2", type "patch" */;
                ingress(dp="network2", inport="net2-router1") {
                    next;
                    outport = "vm2";
                    output;
                    egress(dp="network2", inport="net2-router1", outport="vm2") {
                        output;
                        /* output to "vm2", type "" */;
                    };
                };
            };
        };
    };
};

As you can see, the packet goes through 3 OVN datapaths: network1, router1 and network2. As VM1 is on Worker1 and VM2 is on Worker2, the packet will traverse the tunnel between both hypervisors and thanks to the Geneve encapsulation, the execution pipeline will be distributed:

  • Worker1 will execute both ingress and egress pipelines of network1
  • Worker1 will also perform the routing (lines 10 to 28 above) and the ingress pipeline for network2. Then the packet will be pushed to Worker2 via the tunnel.
  • Worker2 will execute the egress pipeline for network2 delivering the packet to VM2.

Let’s launch a ping from VM1 and check the Geneve traffic on Worker2: 

52:54:00:13:e0:a2 > 52:54:00:ac:67:5b, ethertype IPv4 (0x0800), length 156: (tos 0x0, ttl 64, id 46587, offset 0, flags [DF], proto UDP (17), length 142)
    192.168.50.100.55145 > 192.168.50.101.6081: [bad udp cksum 0xe6a5 -> 0xb087!] Geneve, Flags [C],
vni 0x8,
proto TEB (0x6558),
options [class Open Virtual Networking (OVN) (0x102)
type 0x80(C) len 8
data 00020001]

From what we learnt in the previous post, when the packet arrives to Worker2, the egress pipeline of Datapath 8 (VNI) will be executed being ingress port = 2 and egress port = 1. Let’s see if it matches what ovn-trace gave us earlier:

egress(dp=”network2″, inport=”net2-router1″, outport=”vm2″) 

[root@central ~]# ovn-sbctl get Datapath_Binding network2 tunnel_key
8
[root@central ~]# ovn-sbctl get Port_Binding net2-router1 tunnel-key
2
[root@central ~]# ovn-sbctl get Port_Binding vm2 tunnel-key
1

What about the reply from VM2 to VM1? If we check the tunnel traffic on Worker2 we’ll see the ICMP echo reply packets with different datapath and ingress/egress ports:

22:19:03.896340 52:54:00:ac:67:5b > 52:54:00:13:e0:a2, ethertype IPv4 (0x0800), length 156: (tos 0x0, ttl 64, id 30538, offset 0, flags [DF], proto UDP (17), length 142)
    192.168.50.101.13530 > 192.168.50.100.6081: [bad udp cksum 0xe6a5 -> 0x5419!] Geneve, Flags [C],
vni 0x7,
proto TEB (0x6558),
options [class Open Virtual Networking (OVN) (0x102)
type 0x80(C) len 8
data 00020001]


[root@central ~]# ovn-sbctl get Datapath_Binding network1 tunnel_key
7
[root@central ~]# ovn-sbctl get Port_Binding net1-router1 tunnel-key
2
[root@central ~]# ovn-sbctl get Port_Binding vm1 tunnel-key
1

As we can see, the routing happens locally in the source node; there’s no need to send the packet to any central/network node as the East/West routing is always distributed with OVN. In the case of North/South traffic, where SNAT is required, traffic will go to the gateway node but we’ll cover this in coming posts.

OpenFlow analysis

Until now, we just focused on the Logical elements but ovn-controller will ultimately translate the Logical Flows into physical flows on the OVN bridge.  Let’s inspect the ports that our bridge has on Worker2:

[root@worker2 ~]# ovs-ofctl show br-int
OFPT_FEATURES_REPLY (xid=0x2): dpid:0000404400000002
n_tables:254, n_buffers:0
capabilities: FLOW_STATS TABLE_STATS PORT_STATS QUEUE_STATS ARP_MATCH_IP
actions: output enqueue set_vlan_vid set_vlan_pcp strip_vlan mod_dl_src mod_dl_dst mod_nw_src mod_nw_dst mod_nw_tos mod_tp_src mod_tp_dst
 1(ovn-centra-0): addr:ea:64:c2:a9:86:fe
     config:     0
     state:      0
     speed: 0 Mbps now, 0 Mbps max
 2(ovn-worker-0): addr:de:96:64:2b:21:4a
     config:     0
     state:      0
     speed: 0 Mbps now, 0 Mbps max
 8(vm2): addr:40:44:00:00:00:02
     config:     0
     state:      0
     speed: 0 Mbps now, 0 Mbps max
 LOCAL(br-int): addr:40:44:00:00:00:02
     config:     PORT_DOWN
     state:      LINK_DOWN
     speed: 0 Mbps now, 0 Mbps max
OFPT_GET_CONFIG_REPLY (xid=0x4): frags=normal miss_send_len=0

We have 3 ports in the OVN bridge:

  1. ovn-centra-0: Tunnel port with Central node
  2. ovn-worker-0: Tunnel port with Worker1
  3. vm2: Our fake virtual machine that we bound to Worker2

When ICMP echo request packets are coming from VM1, we expect them to be arriving via port 2 and being delivered to VM2 on port 8. We can check this by inspecting the flows at table 0 (input) and table 65 (output) for br-int. For a more detailed information of the OpenFlow tables, see ovn-architecture(7) document, section “Architectural Physical Life Cycle of a Packet”.

[root@worker2 ~]# ovs-ofctl dump-flows br-int table=0 | grep idle_age='[0-1],'
cookie=0x0, duration=3845.572s, table=0, n_packets=2979, n_bytes=291942, idle_age=0, priority=100,in_port=2 actions=move:NXM_NX_TUN_ID[0..23]->OXM_OF_METADATA[0..23],move:NXM_NX_TUN_METADATA0[16..30]->NXM_NX_REG14[0..14],move:NXM_NX_TUN_METADATA0[0..15]->NXM_NX_REG15[0..15],resubmit(,33)


[root@worker2 ~]# ovs-ofctl dump-flows br-int table=65 | grep idle_age='[0-1],'
 cookie=0x0, duration=3887.336s, table=65, n_packets=3062, n_bytes=297780, idle_age=0, priority=100,reg15=0x1,metadata=0x8 actions=output:8

I was filtering the dump-flows output to display only those flows with an idle_age of just 0 or 1 seconds. This means that they’ve been recently hit so if we’re inspecting tables with lots of flows, we would filter away unwanted flows to focus just on the ones that we’re really interested. Please, note that for this particular example, I’ve set the VM2 link down to see only incoming ICMP packets from VM1 and hide the replies.

Let’s inspect the input flow on table 0 where the following actions happen:

actions=
move:NXM_NX_TUN_ID[0..23]->OXM_OF_METADATA[0..23],
move:NXM_NX_TUN_METADATA0[16..30]->NXM_NX_REG14[0..14],
move:NXM_NX_TUN_METADATA0[0..15]->NXM_NX_REG15[0..15],
resubmit(,33)

These actions will:

  • Copy the 24 bits of the VNI (Tunnel ID / Logical Datapath) to the OpenFlow metadata.
  • Copy bits 16-30 of the tunnel data (Ingress port) to the OpenvSwitch register 14
  • Copy bits 0-15 of the tunnel data (Egress port) to the OpenvSwitch register 15.

From the ovn-architecture document, we can read:

logical datapath field
A field that denotes the logical datapath through which a
packet is being processed. OVN uses the field that Open‐
Flow 1.1+ simply (and confusingly) calls “metadata” to
store the logical datapath. (This field is passed across
tunnels as part of the tunnel key.)

logical input port field
A field that denotes the logical port from which the
packet entered the logical datapath. OVN stores this in
Open vSwitch extension register number 14.

Geneve and STT tunnels pass this field as part of the
tunnel key. Although VXLAN tunnels do not explicitly
carry a logical input port, OVN only uses VXLAN to commu‐
nicate with gateways that from OVN’s perspective consist
of only a single logical port, so that OVN can set the
logical input port field to this one on ingress to the
OVN logical pipeline.

logical output port field
A field that denotes the logical port from which the
packet will leave the logical datapath. This is initial‐
ized to 0 at the beginning of the logical ingress pipe‐
line. OVN stores this in Open vSwitch extension register
number 15.

Geneve and STT tunnels pass this field as part of the
tunnel key. VXLAN tunnels do not transmit the logical
output port field. Since VXLAN tunnels do not carry a
logical output port field in the tunnel key, when a
packet is received from VXLAN tunnel by an OVN hypervi‐
sor, the packet is resubmitted to table 8 to determine
the output port(s); when the packet reaches table 32,
these packets are resubmitted to table 33 for local de‐
livery by checking a MLF_RCV_FROM_VXLAN flag, which is
set when the packet arrives from a VXLAN tunnel. 

Similarly, we can see that in the output action from table 65, the OpenFlow rule is matching on “reg15=0x1,metadata=0x8” when it outputs the packet to the OpenFlow port number 8 (VM2). As we saw earlier, metadata 8 corresponds to network2 Logical Switch and the output port (reg15) 1 corresponds to the VM2 logical port (tunnel_key 1).


Due to its distributed nature and everything being OpenFlow based, it may be a little bit tricky to trace packets when implementing Software Defined Networking with OVN compared to traditional solutions (iptables, network namespaces, …). Knowing the above concepts and getting familiar with the tools is key to debug OVN systems in an effective way.