Recently, OVN has introduced BGP support and I did not have the time to follow the development so I decided to use the help of AI (Claude Code CLI) to learn about the new feature. The path I chose here is:
- Run one of the existing BGP tests (ovn multinode bgp unnumbered)
- Use AI (claude-sonnet-4.5 model) to help me understand what the test does
- Identify the parts of the codebase that implement some of the bits in the test
- Do a small modification to the test to do something new
1. Run the BGP test from the OVN sources
To run this test, I need first to deploy an ovn-fake-multinode setup with 4 chassis and 4 gateways. I did it just by following the instructions in the README.md file.
$ sudo -E CHASSIS_COUNT=4 GW_COUNT=4 ./ovn_cluster.sh startAfter deploying the cluster, you’ll have multiple containers running but only the ovn-central-az1, ovn-gw-1, and ovn-gw-2 are relevant to this test. This cluster will have some OVN resources but the test cleans them up upon start.
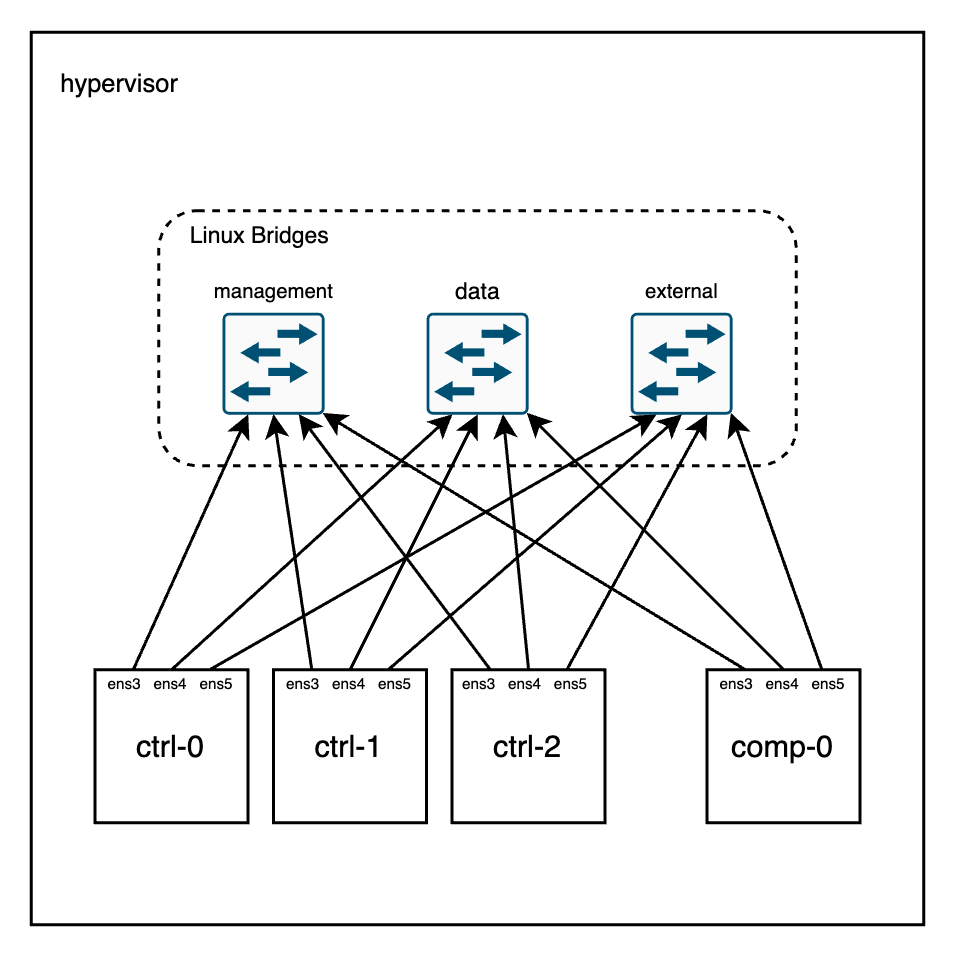
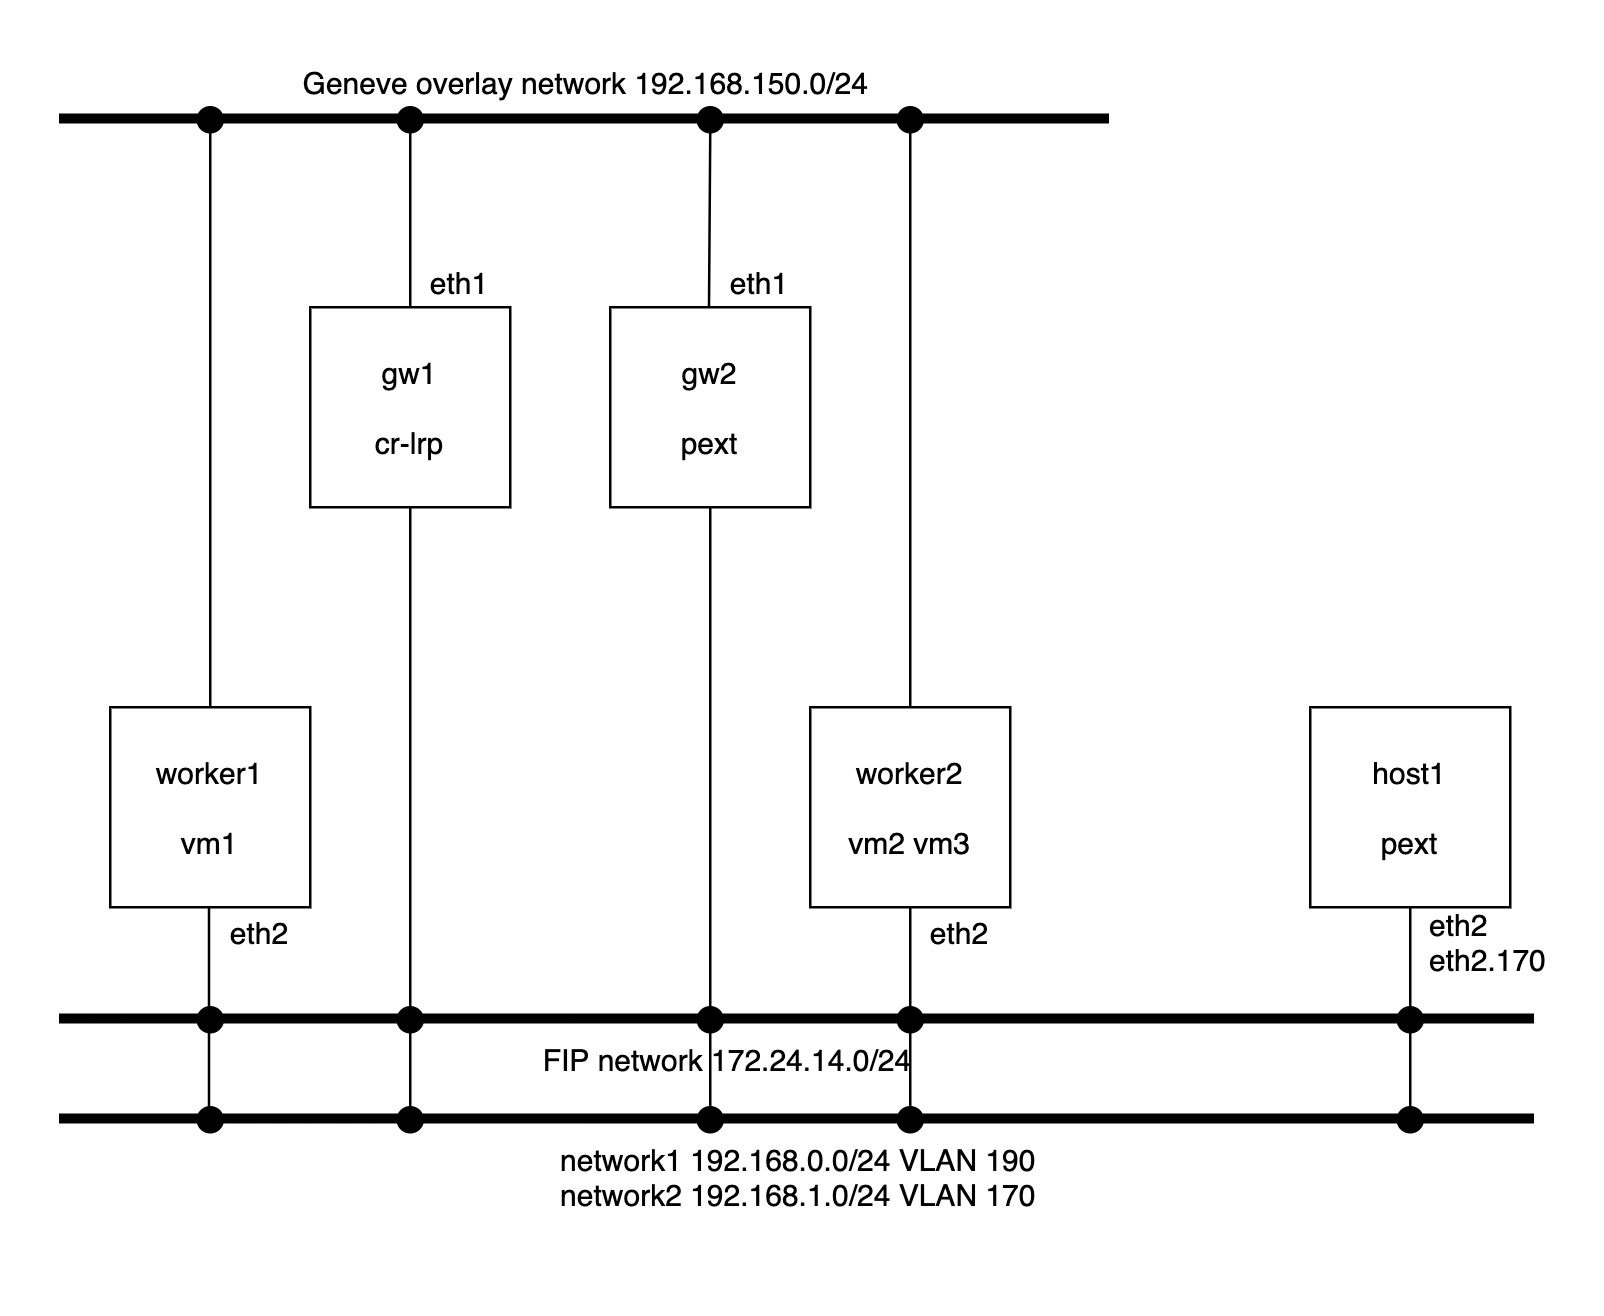
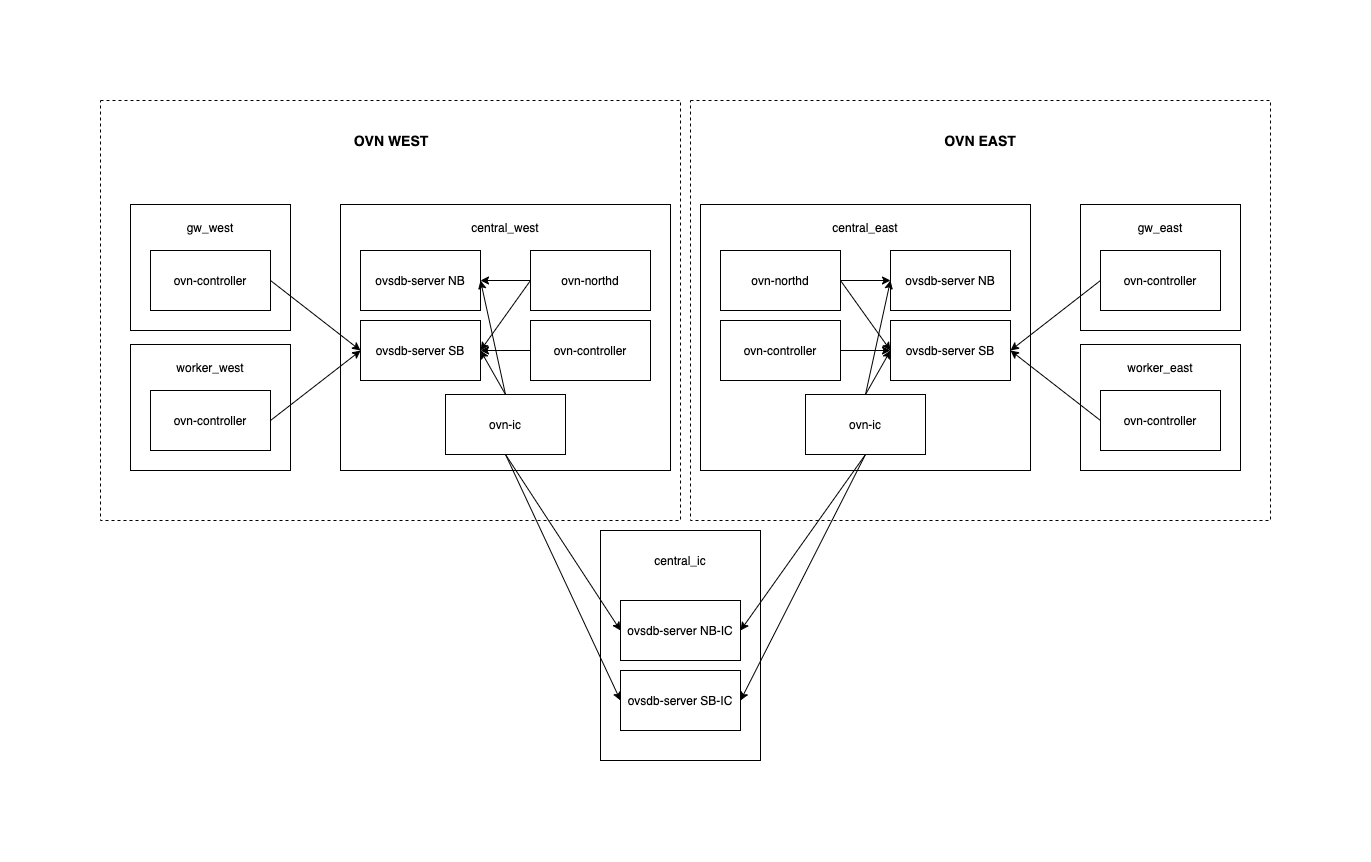
I did not want to investigate much how these containers are wired so I asked Claude to read the sources and produce a diagram for me. It also helped me to render it into a PNG file using ImageMagick :p
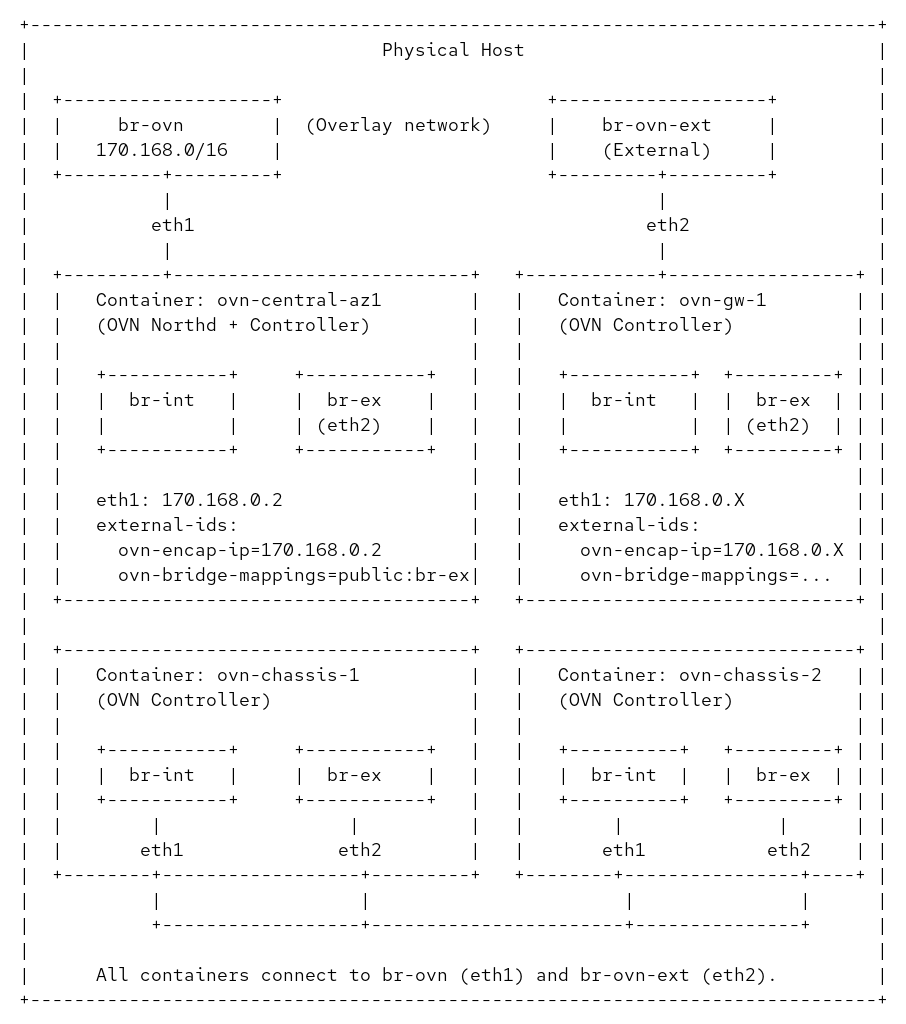
Essentially, it will create two OVS bridges in my host to connect eth1 on each container for the underlay and eth2 for the dataplane. The eth0 interface is connected to the podman network for management.
Now we run the test and stop it before the clean up. This you can do by adding a check false right before the cleanup, and then executing the test like this:
OVS_PAUSE_TEST=1 make check-multinode TESTSUITEFLAGS="-k 'ovn multinode bgp unnumbered' -v"
Once the test stops, you can see that it’s completed successfully and it was able to ping some IP address, and the containers are running with the configuration and resources created by the test.
multinode.at:2959: waiting until m_as ovn-gw-1 ip netns exec frr-ns ping -W 1 -c 1 172.16.10.2...
PING 172.16.10.2 (172.16.10.2) 56(84) bytes of data.
64 bytes from 172.16.10.2: icmp_seq=1 ttl=62 time=2.32 ms

--- 172.16.10.2 ping statistics ---
1 packets transmitted, 1 received, 0% packet loss, time 0ms
rtt min/avg/max/mdev = 2.322/2.322/2.322/0.000 ms
multinode.at:2959: wait succeeded immediately
multinode.at:2960: waiting until m_as ovn-gw-2 ip netns exec frr-ns ip route | grep -q 'ext1'...
multinode.at:2960: wait succeeded immediately
multinode.at:2961: waiting until m_as ovn-gw-2 ip netns exec frr-ns ping -W 1 -c 1 172.16.10.2...
PING 172.16.10.2 (172.16.10.2) 56(84) bytes of data.
64 bytes from 172.16.10.2: icmp_seq=1 ttl=62 time=1.77 ms

--- 172.16.10.2 ping statistics ---
1 packets transmitted, 1 received, 0% packet loss, time 0ms
rtt min/avg/max/mdev = 1.773/1.773/1.773/0.000 ms
multinode.at:2961: wait succeeded immediately
false
./ovn-macros.at:856: "$@"
./ovn-macros.at:856: exit code was 1, expected 0
=====================================================
Set following environment variable to use various ovs utilities
export OVS_RUNDIR=/root/ovn/tests/multinode-testsuite.dir/17
Press ENTER to continue:


$ podman exec ovn-central-az1 ovn-nbctl show | grep -E '^(router|switch)'
switch 05e453e9-f5b2-47b9-9eb6-10ef6ea8a08c (ls-ovn-gw-2-ext0)
switch 8a12c075-6367-46b0-ac5a-88346450fc60 (ls-ovn-gw-1-ext0)
switch 3cc96979-1aab-4cd3-a84b-6f5f36bd4a42 (ls-guest-ovn-gw-1)
switch e24ad9c9-ef80-4686-96eb-88ef47d9bc01 (ls-guest-ovn-gw-2)
switch 9a279d1b-0929-4386-a704-fb9faaf6dfa6 (ls-join)
router e0a37965-c854-4c17-a4bb-4401d61c48a6 (lr-guest)
router 1f81175b-1168-4956-b7a8-64c85c07af4f (lr-ovn-gw-1-ext0)
router ce2161ff-ea11-4fb0-954b-75f0cf26f3d7 (lr-ovn-gw-2-ext0)
2. Use Claude AI to understand what the test does
At this point I read the test and I can see that there’s a fake VM with a Floating IP (172.16.10.2) that’s reachable through the simulated ToR switches. The ToRs learn the route via BGP, but I’m struggling to understand the exact topology and configuration because the test uses several layers of macros that call other macros.
Claude to the rescue!
I used Claude to help me:
- Trace through the macro definitions to understand what topology gets created
- Identify which components run where (containers, namespaces, VRFs)
- Map out the BGP peering relationships and AS numbers
- Understand how FRR is configured on both the ToRs and OVN gateways
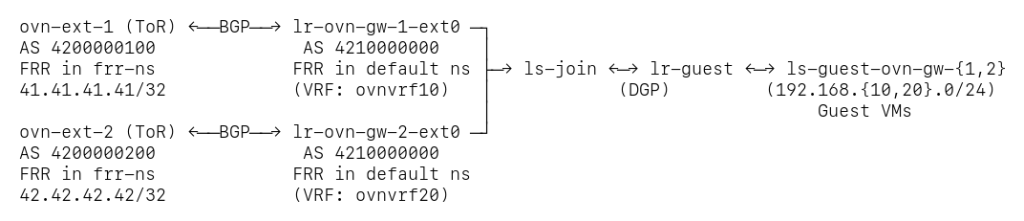
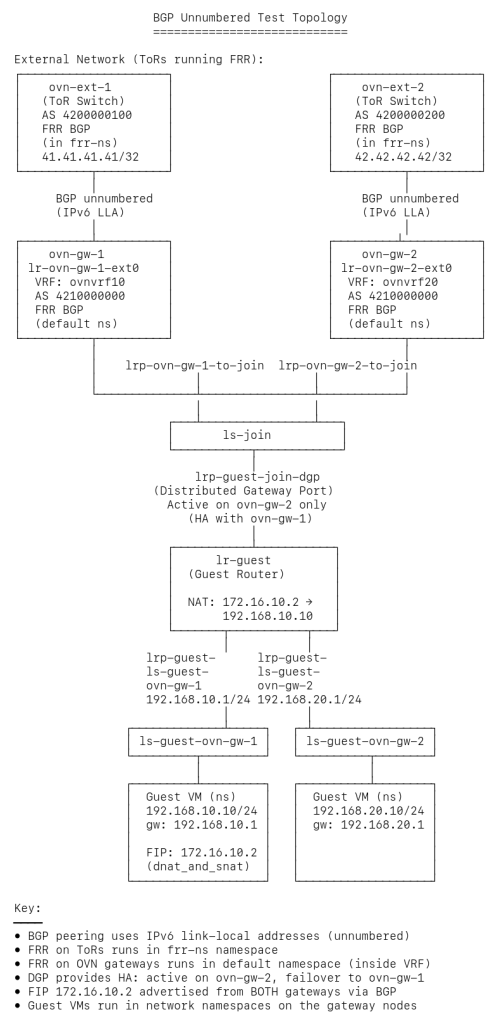
- Figure out why there are two separate FRR instances running on the same container The key insight Claude helped me understand was that the test simulates both the ToR switches and the OVN gateways within the same container nodes, using:
- Network namespaces (frr-ns) to isolate the ToR’s network stack
- Two separate FRR instances – one for the ToR (in frr-ns) and one for the OVN gateway (in default namespace, using VRFs)
- BGP unnumbered peering using IPv6 link-local addresses between them
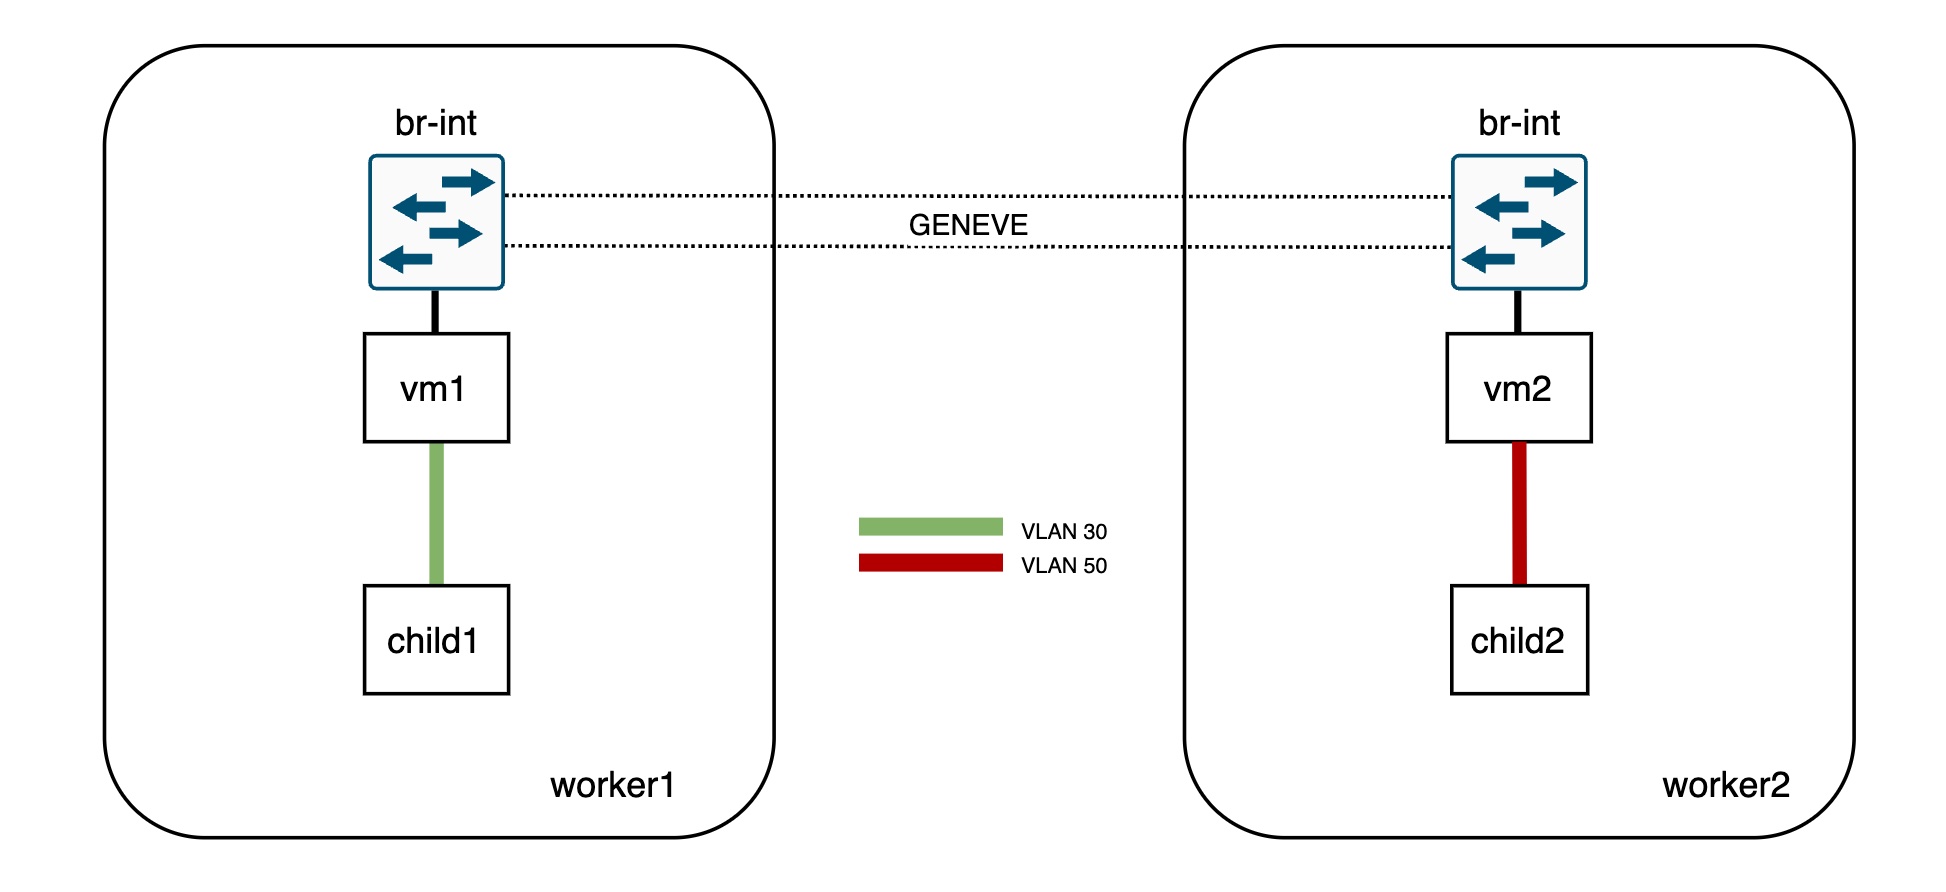
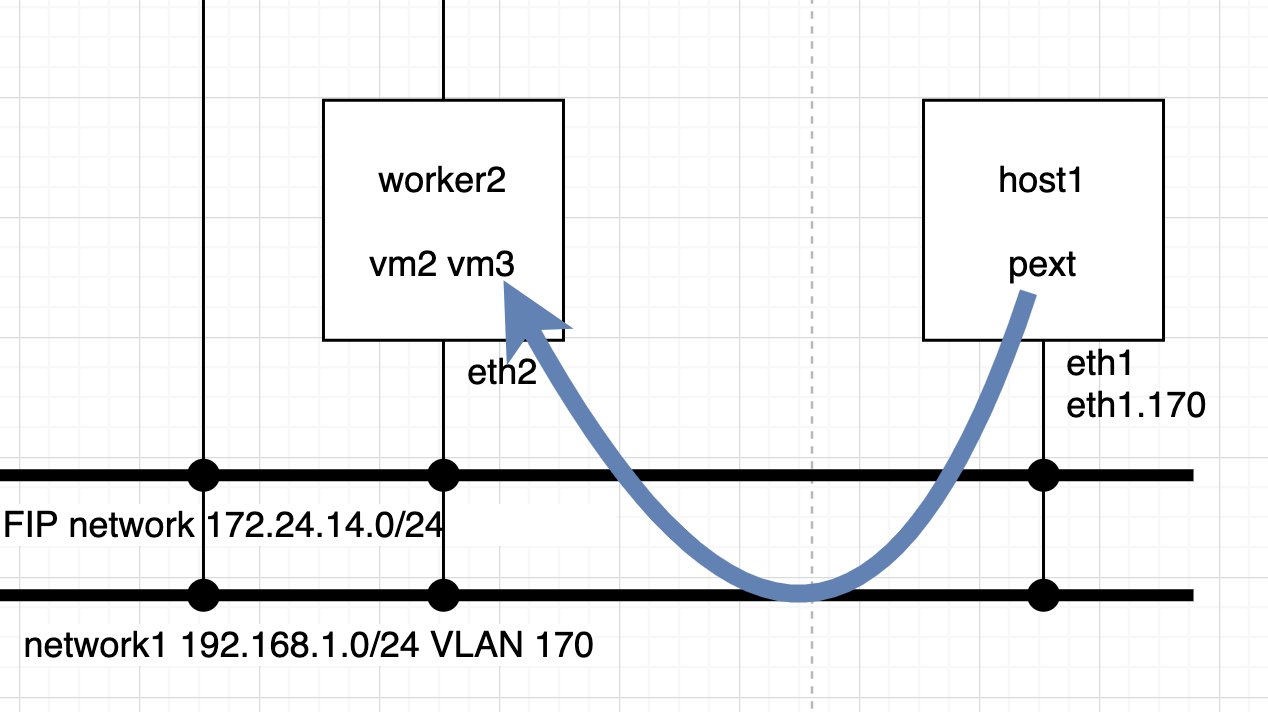
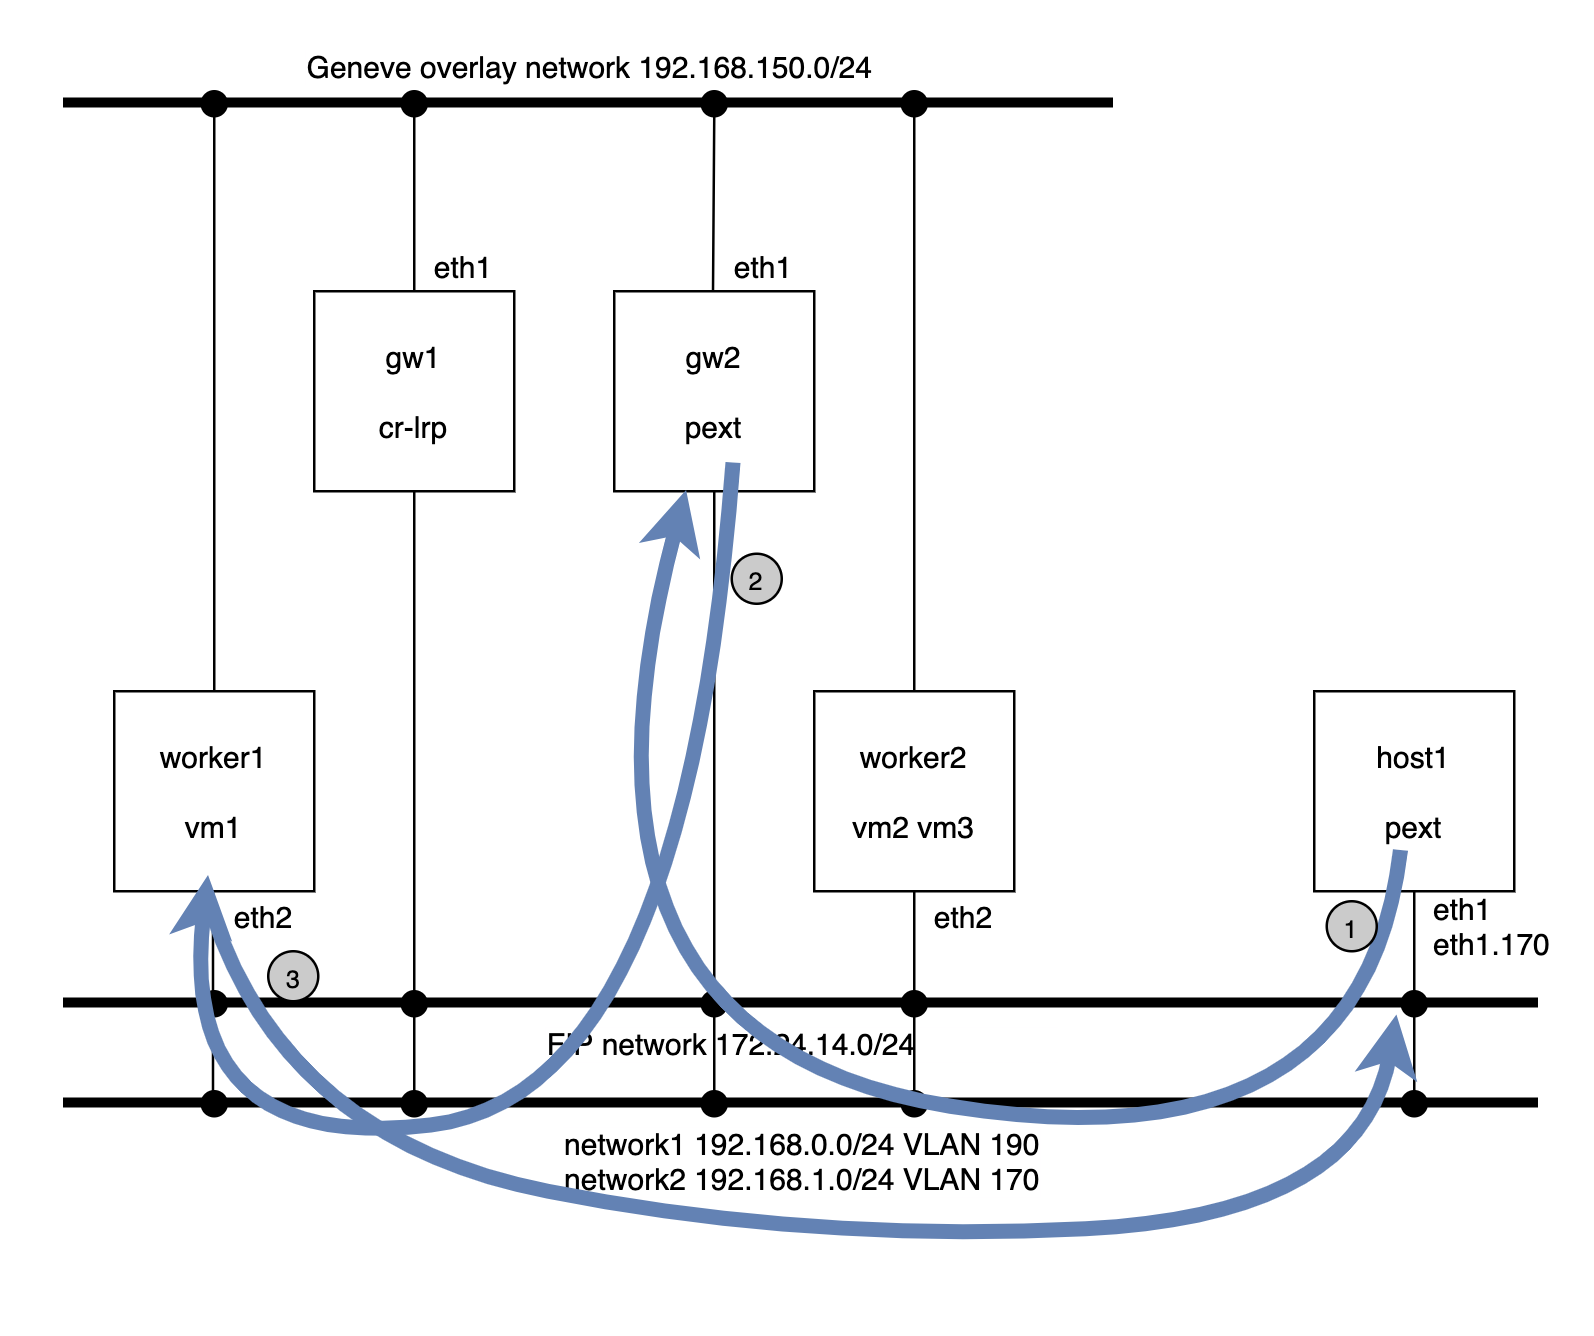
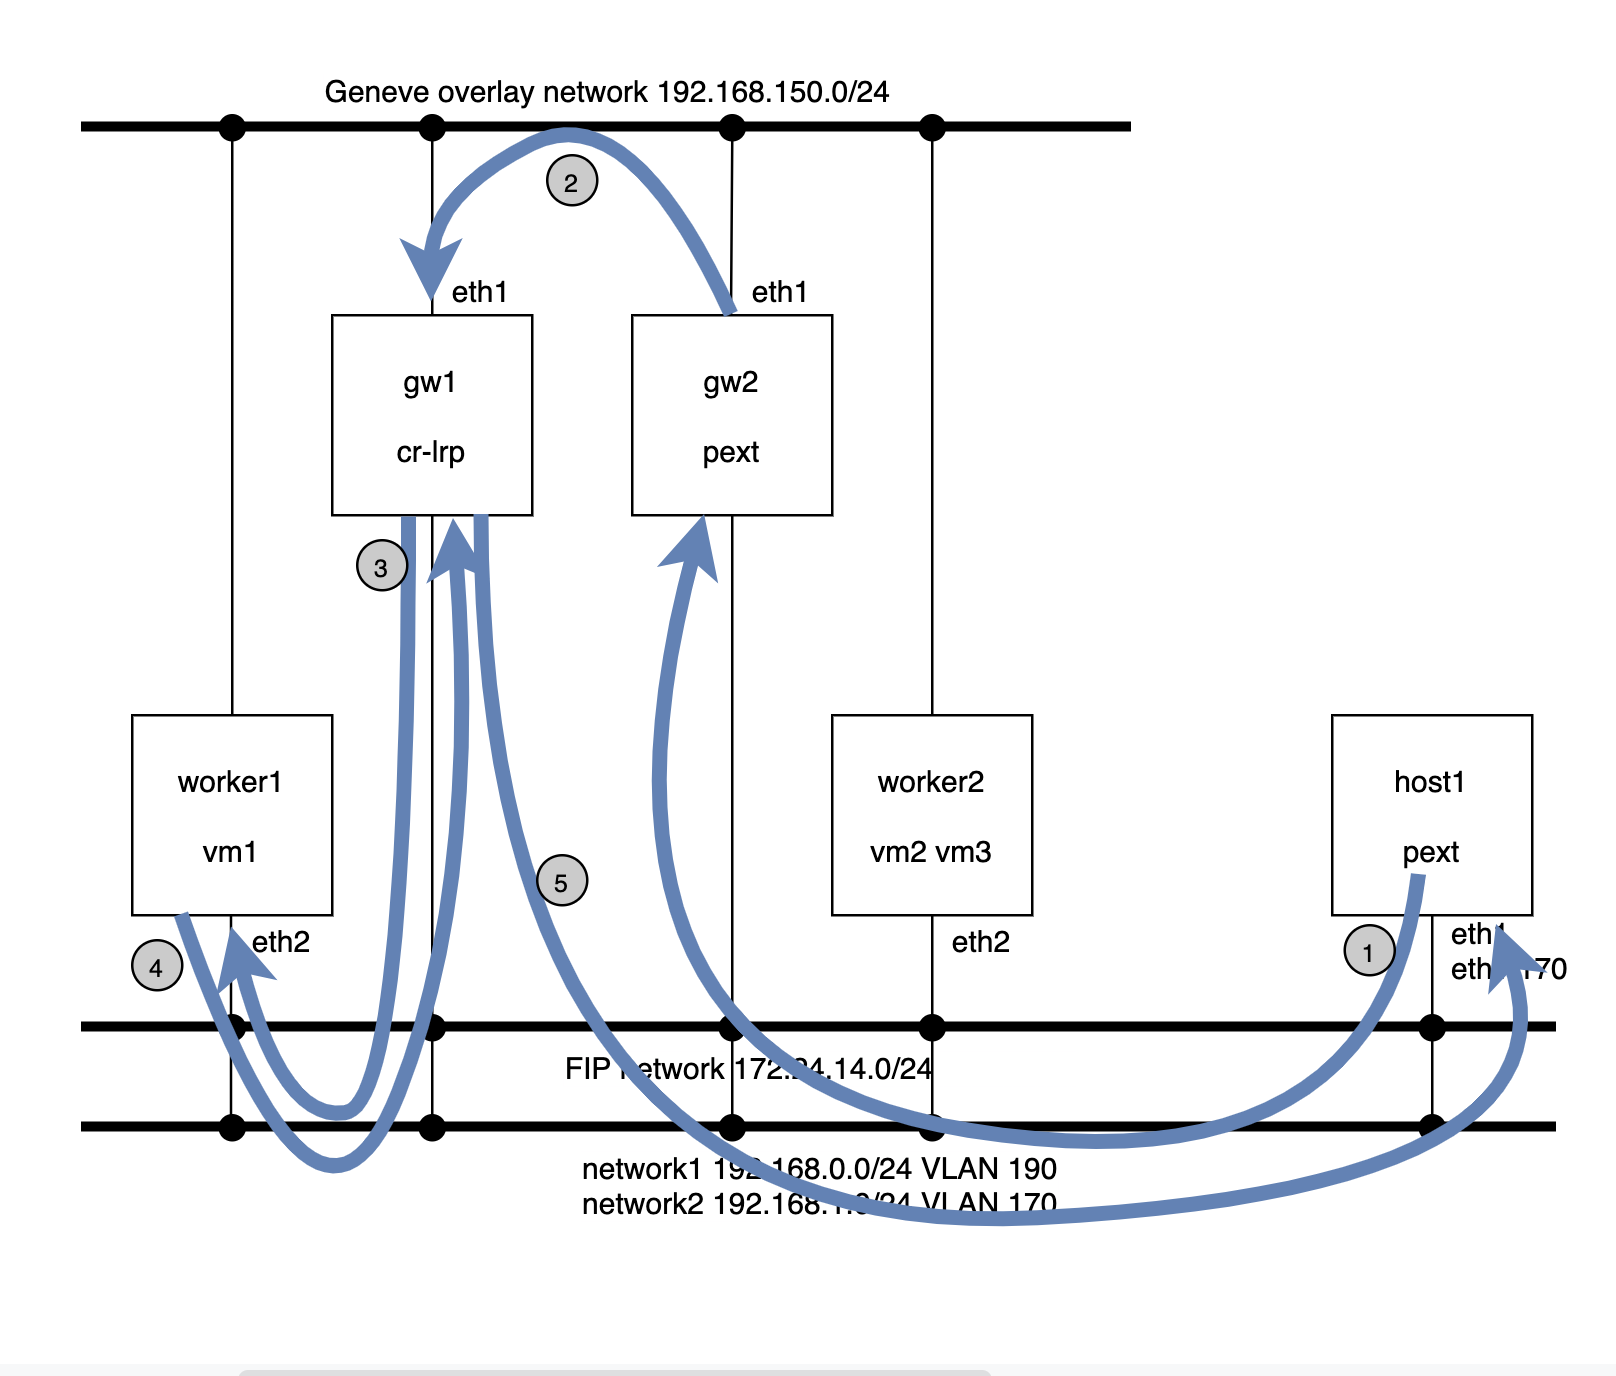
As a bonus, I asked Claude to draw a couple of diagrams for me to better understand the topology that this test creates:
Since I stopped the test before the cleanup, I told Claude how to access the remote lab and asked to inspect the live environment via SSH commands.
NOTE: Before I got the answer below I had been asking Claude things about the macros that the test uses and it’s been unpacking and reading a lot of the OVN code that I checked out locally. I re-ran this on a fresh session and it failed to figure out things like who creates the VRFs where the blackhole routes are installed, so it required a few more follow-up questions until I was able to find the right answers.
> I would like you to inspect the live deployment and show how the routes get advertised (eg. listing the different OVN tables, FRR configuration, etcetera). You can access the live environment by running 'ssh ovnlab' directly and using 'sudo'.


⏺ Perfect! Let me trace through exactly how the Floating IP (172.16.10.2) gets advertised from OVN through to the external ToR switches via BGP.

  ---  Step 1: NAT Configuration in OVN Northbound

  First, the NAT rule is configured on the guest router:

  $ podman exec ovn-central-az1 ovn-nbctl list NAT
  _uuid               : 4305c6db-b431-400d-b3e8-248d920394fc
  external_ip         : "172.16.10.2"
  logical_ip          : "192.168.10.10"
  type                : dnat_and_snat
  gateway_port        : lrp-guest-join-dgp
  options             : {add_route="true", ...}

  Key points:
  - external_ip: 172.16.10.2 (the Floating IP)
  - logical_ip: 192.168.10.10 (the internal VM IP)
  - gateway_port: Associated with the Distributed Gateway Port (DGP)
  - add_route=true: Tells OVN to create a route for this NAT entry

  Step 2: Dynamic Routing and VRF Configuration

  The gateway routers are configured with dynamic routing and VRF settings:

  $ podman exec ovn-central-az1 ovn-nbctl get logical_router lr-ovn-gw-1-ext0 options
  {chassis=ovn-gw-1, dynamic-routing="true", dynamic-routing-vrf-id="10"}

  $ podman exec ovn-central-az1 ovn-nbctl get logical_router_port lrp-ovn-gw-1-ext0 options
  {dynamic-routing-maintain-vrf="true", dynamic-routing-redistribute=nat,
   routing-protocol-redirect=lsp-ovn-gw-1-ext0-bgp, routing-protocols="BGP,BFD"}

  This configuration tells OVN:
  - Enable dynamic routing on lr-ovn-gw-1-ext0
  - Use VRF ID 10 (will create VRF named ovnvrf10)
  - dynamic-routing-maintain-vrf=true on the router port - This is the key setting that tells ovn-controller to create and maintain the VRF in the kernel
  - Redistribute NAT routes via the router port
  - Redirect BGP protocol traffic to the lsp-ovn-gw-1-ext0-bgp port

  When ovn-controller on the ovn-gw-1 chassis sees the dynamic-routing-maintain-vrf=true option, it automatically creates the VRF in the kernel:

  $ podman exec ovn-gw-1 ip link show type vrf
  11: ovnvrf10: <NOARP,MASTER,UP,LOWER_UP> mtu 65575 qdisc noqueue state UP mode DEFAULT group default qlen 1000
      link/ether 7a:7c:6f:2c:0d:22 brd ff:ff:ff:ff:ff:ff

  The VRF name is constructed as ovnvrf + dynamic-routing-vrf-id (10 in this case).

  Similarly, on ovn-gw-2, the VRF ID 20 creates ovnvrf20.

  Step 3: Advertised Routes in OVN Southbound

  OVN northd processes the NAT configuration and creates advertised route entries:

  $ podman exec ovn-central-az1 ovn-sbctl list Advertised_Route
  _uuid               : 360a360a-4ff4-4e87-888f-80e7c3b55e0a
  ip_prefix           : "172.16.10.2"
  logical_port        : lrp-ovn-gw-1-to-join
  ...

  _uuid               : d3a74c47-2ad9-471e-8b5e-e186ab774f21
  ip_prefix           : "172.16.10.2"
  logical_port        : lrp-ovn-gw-2-to-join
  ...

  Both gateway routers have advertised route entries for 172.16.10.2 because:
  - Each gateway router (lr-ovn-gw-1-ext0, lr-ovn-gw-2-ext0) has dynamic-routing-redistribute=nat configured on its port connecting to the join switch
  - The NAT entry from lr-guest gets redistributed to both gateway routers
  - Each gateway then advertises the FIP to its respective ToR (ovn-ext-1 and ovn-ext-2)
  - This provides connectivity from both external ASNs (ASN 4200000100 and ASN 4200000200) to reach the FIP

  The DGP location only matters for actual traffic forwarding, not for route advertisement. Both ToRs can advertise reachability to 172.16.10.2, and when traffic arrives at either gateway, OVN's overlay handles forwarding it to whichever chassis actually hosts the DGP.

  Step 4: Blackhole Routes in the Kernel

  OVN-controller on each gateway node installs blackhole routes in the VRF:

  $ podman exec ovn-gw-1 ip route show vrf ovnvrf10
  blackhole 172.16.10.2 proto 84 metric 1000

  $ podman exec ovn-gw-2 ip route show vrf ovnvrf20
  blackhole 172.16.10.2 proto 84 metric 1000

  These blackhole routes serve as markers for FRR to detect and advertise via BGP. They don't actually route traffic (that's handled by OVN flows), but FRR's redistribute kernel configuration picks them up.

  Step 5: FRR BGP Advertisement (OVN Gateway Side)

  FRR on the OVN gateway sees the kernel route and advertises it to its BGP neighbor:

  $ podman exec ovn-gw-1 vtysh --vty_socket /run/frr/ -c "show bgp vrf ovnvrf10 ipv4"
  BGP table version is 1, local router ID is 14.14.14.14, vrf id 11
  Default local pref 100, local AS 4210000000

       Network          Next Hop            Metric LocPrf Weight Path
   *>  172.16.10.2/32   0.0.0.0               1000         32768 ?

  The route shows:
  - Next Hop: 0.0.0.0 - locally originated (from kernel redistribution)
  - Weight: 32768 - default weight for local routes
  - Path: ? - incomplete origin (redistributed from kernel)

  Step 6: BGP Peering (Unnumbered)

  The OVN gateway and ToR are peered using BGP unnumbered (IPv6 link-local addresses):

  $ podman exec ovn-gw-1 vtysh --vty_socket /run/frr/ -c "show bgp vrf ovnvrf10 neighbors ext0-bgp"
  BGP neighbor on ext0-bgp: fe80::a8ed:baff:feb6:585e, remote AS 4200000100, local AS 4210000000
  BGP state = Established, up for 1d06h12m
  ...
  Prefix statistics:
    0 accepted, 1 sent prefixes

  Key details:
  - Neighbor: fe80::a8ed:baff:feb6:585e (IPv6 link-local - unnumbered)
  - Remote AS: 4200000100 (the ToR's ASN)
  - Local AS: 4210000000 (OVN gateway's ASN)
  - Sent prefixes: 1 (the 172.16.10.2/32 route)

  Step 7: FRR BGP Learning (ToR Side)

  The ToR's FRR instance receives and accepts the route:

  $ podman exec ovn-gw-1 vtysh --vty_socket /run/frr/frr-ns/ -c "show bgp ipv4"
  BGP table version is 1, local router ID is 41.41.41.41, vrf id 0
  Default local pref 100, local AS 4200000100

       Network          Next Hop            Metric LocPrf Weight Path
   *>  172.16.10.2/32   ext1                  1000             0 4210000000 ?

  The ToR now knows:
  - Network: 172.16.10.2/32
  - Next Hop: ext1 (the interface toward the OVN gateway)
  - Metric: 1000 (inherited from the advertised route)
  - ASN Path: 4210000000 (learned from the OVN gateway's ASN)

  Summary: Complete Advertisement Chain

  1. NAT Config (NB)
     ↓
  2. Dynamic Routing + VRF Config (NB)
     ↓
  3. VRF Creation (Kernel) ← ovn-controller sees dynamic-routing-maintain-vrf=true
     ↓
  4. Advertised Routes (SB) ← northd processing
     ↓
  5. Blackhole Routes (Kernel VRF) ← ovn-controller
     ↓
  6. BGP Table (FRR Gateway) ← redistribute kernel
     ↓
  7. BGP Peering (IPv6 LLA)
     ↓
  8. BGP Table (FRR ToR) ← received from peer

  This shows the complete journey of how a NAT entry in OVN becomes a BGP route advertised to external infrastructure, enabling seamless integration between OVN's virtual networking and physical network routing.
3. Identify the parts of the codebase that implement some of the bits in the test
At this point I believe I understand what the test does and how the BGP implementation works on the surface. In order for me to get a deeper understanding of certain parts of the code I want to understand how and when the VRF is created by ovn-controller. Since Claude has access to the OVN sources and my live environment, it should be able to give me good pointers to it 🙂
> I want to get some details (source code level) about how and when ovn-controller creates the VRF where it installs the blackhole routes.


⏺ Let me trace through the source code to show you exactly how and when ovn-controller creates the VRF and installs the blackhole routes.

⏺ Read(ovn/controller/route-exchange.c)
  ⎿  Read 100 lines

⏺ Search(pattern: "vrf.*create|create.*vrf", path: "ovn/controller", output_mode: "content")
  ⎿  Found 5 lines (ctrl+o to expand)

⏺ Read(ovn/controller/route-exchange.c)
  ⎿  Read 150 lines

⏺ Read(ovn/controller/route-exchange-netlink.c)
  ⎿  Read 80 lines

⏺ Now let me check where the advertise_datapath_entry gets populated with the maintain_vrf flag:

⏺ Search(pattern: "maintain_vrf.*=|->maintain_vrf", path: "ovn/controller", output_mode: "content")
  ⎿  Found 2 lines (ctrl+o to expand)

⏺ Read(ovn/controller/route.c)
  ⎿  Read 50 lines

⏺ Perfect! Now let me check how advertised routes get added:

⏺ Search(pattern: "Advertised_Route|advertised.*route", path: "ovn/controller/route.c", output_mode: "content")
  ⎿  Found 3 lines (ctrl+o to expand)

⏺ Read(ovn/controller/route.c)
  ⎿  Read 80 lines

⏺ Perfect! Now I have the complete picture. Let me create a detailed source code-level explanation:

  ---
  Source Code Deep Dive: VRF Creation and Blackhole Route Installation

  Overview

  The VRF creation and blackhole route installation happens in ovn-controller through a multi-step process coordinated between several source files. Let me trace through the exact code path.

  Step 1: Checking for dynamic-routing-maintain-vrf Option

  File: controller/route.c (lines 206-209)

  ad->maintain_vrf |=
      smap_get_bool(&repb->options,
                    "dynamic-routing-maintain-vrf",
                    false);

  What happens here:
  - ovn-controller iterates through all router port bindings (repb) that have dynamic routing enabled
  - For each port, it checks if the dynamic-routing-maintain-vrf option is set to true
  - If found, it sets the maintain_vrf flag in the advertise_datapath_entry structure
  - This flag tells ovn-controller that it is responsible for creating and managing the VRF

  Step 2: Determining VRF Name

  File: controller/route.c (lines 211-225)

  const char *vrf_name = smap_get(&repb->options,
                                  "dynamic-routing-vrf-name");
  if (vrf_name && strlen(vrf_name) >= IFNAMSIZ) {
      // Warn and ignore if name is too long
      vrf_name = NULL;
  }
  if (vrf_name) {
      memcpy(ad->vrf_name, vrf_name, strlen(vrf_name) + 1);
  } else {
      snprintf(ad->vrf_name, sizeof ad->vrf_name, "ovnvrf%"PRIu32,
               route_get_table_id(ad->db));
  }

  What happens here:
  - First checks if a custom VRF name is specified via dynamic-routing-vrf-name option
  - If no custom name is provided, constructs the default name as ovnvrf + VRF ID
  - For example, with dynamic-routing-vrf-id=10, it creates ovnvrf10

  Step 3: Creating the VRF

  File: controller/route-exchange.c (lines 265-277)

  if (ad->maintain_vrf) {
      if (!sset_contains(&old_maintained_vrfs, ad->vrf_name)) {
          error = re_nl_create_vrf(ad->vrf_name, table_id);
          if (error && error != EEXIST) {
              VLOG_WARN_RL(&rl,
                           "Unable to create VRF %s for datapath "
                           UUID_FMT": %s.", ad->vrf_name,
                           UUID_ARGS(&ad->db->header_.uuid),
                           ovs_strerror(error));
              SET_ROUTE_EXCHANGE_NL_STATUS(error);
              continue;
          }
      }
      sset_add(&_maintained_vrfs, ad->vrf_name);
  }

  What happens here:
  - During the route_exchange_run() function execution (called on every ovn-controller iteration)
  - Checks if the VRF was already created in a previous iteration (by checking old_maintained_vrfs)
  - If not, calls re_nl_create_vrf() to create it via netlink
  - Adds the VRF name to _maintained_vrfs set to track it
  - If VRF already exists (EEXIST error), silently continues (this is normal)

  Step 4: Netlink VRF Creation

  File: controller/route-exchange-netlink.c (lines 42-77)

  int
  re_nl_create_vrf(const char *ifname, uint32_t table_id)
  {
      if (!TABLE_ID_VALID(table_id)) {
          // ... error handling
          return EINVAL;
      }

      // Prepare netlink message
      struct ofpbuf request;
      uint8_t request_stub[NETNL_REQ_BUFFER_SIZE];
      ofpbuf_use_stub(&request, request_stub, sizeof(request_stub));

      // Create RTM_NEWLINK message with VRF attributes
      nl_msg_put_nlmsghdr(&request, 0, RTM_NEWLINK,
                          NLM_F_REQUEST | NLM_F_ACK | NLM_F_CREATE | NLM_F_EXCL);
      ifinfo = ofpbuf_put_zeros(&request, sizeof *ifinfo);
      nl_msg_put_string(&request, IFLA_IFNAME, ifname);  // VRF name

      ifinfo->ifi_change = ifinfo->ifi_flags = IFF_UP;   // Bring it UP
      linkinfo_off = nl_msg_start_nested(&request, IFLA_LINKINFO);
      nl_msg_put_string(&request, IFLA_INFO_KIND, "vrf");  // Type: VRF
      infodata_off = nl_msg_start_nested(&request, IFLA_INFO_DATA);
      nl_msg_put_u32(&request, IFLA_VRF_TABLE, table_id);  // VRF table ID
      nl_msg_end_nested(&request, infodata_off);
      nl_msg_end_nested(&request, linkinfo_off);

      // Send to kernel via netlink
      err = nl_transact(NETLINK_ROUTE, &request, NULL);

      ofpbuf_uninit(&request);
      return err;
  }

  What happens here:
  - Constructs a netlink RTM_NEWLINK message to create a new network interface
  - Sets the interface type to "vrf"
  - Associates it with the routing table ID (from dynamic-routing-vrf-id)
  - Sets the interface to UP state immediately
  - Sends the netlink message to the kernel's routing subsystem
  - The kernel creates the VRF device (e.g., ovnvrf10)

  Step 5: Reading Advertised Routes from Southbound DB

  File: controller/route.c (lines 267-295)

  const struct sbrec_advertised_route *route;
  SBREC_ADVERTISED_ROUTE_TABLE_FOR_EACH (route,
                                         r_ctx_in->advertised_route_table) {
      struct advertise_datapath_entry *ad =
          advertise_datapath_find(r_ctx_out->announce_routes,
                                  route->datapath);
      if (!ad) {
          continue;
      }

      struct in6_addr prefix;
      unsigned int plen;
      if (!ip46_parse_cidr(route->ip_prefix, &prefix, &plen)) {
          // ... error handling
          continue;
      }

      if (!lport_is_local(r_ctx_in->sbrec_port_binding_by_name,
                          r_ctx_in->chassis,
                          route->logical_port->logical_port)) {
          // Skip routes for ports not on this chassis
          continue;
      }

      // Add route to the advertise_datapath_entry
      struct advertise_route_entry *ar = xmalloc(sizeof(*ar));
      ar->addr = prefix;
      ar->plen = plen;
      ar->priority = priority;
      hmap_insert(&ad->routes, &ar->node,
                  advertise_route_hash(&prefix, plen));
  }

  What happens here:
  - Reads all Advertised_Route entries from the Southbound database
  - These are created by northd when it processes NAT rules with redistribution enabled
  - Filters to only routes whose logical port is bound to this chassis
  - Builds a hash map of routes to be installed in the kernel

  Step 6: Installing Blackhole Routes

  File: controller/route-exchange-netlink.c (lines 98-121)

  static int
  modify_route(uint32_t type, uint32_t flags_arg, uint32_t table_id,
               const struct in6_addr *dst, unsigned int plen,
               unsigned int priority)
  {
      uint32_t flags = NLM_F_REQUEST | NLM_F_ACK;
      bool is_ipv4 = IN6_IS_ADDR_V4MAPPED(dst);
      struct rtmsg *rt;

      flags |= flags_arg;

      struct ofpbuf request;
      // ... buffer initialization

      nl_msg_put_nlmsghdr(&request, 0, type, flags);
      rt = ofpbuf_put_zeros(&request, sizeof *rt);
      rt->rtm_family = is_ipv4 ? AF_INET : AF_INET6;
      rt->rtm_table = RT_TABLE_UNSPEC;
      rt->rtm_protocol = RTPROT_OVN;      // Mark as OVN-managed (proto 84)
      rt->rtm_type = RTN_BLACKHOLE;       // ← BLACKHOLE route type
      rt->rtm_scope = RT_SCOPE_UNIVERSE;

  What happens here:
  - For each advertised route, constructs a netlink RTM_NEWROUTE message
  - Sets route type to RTN_BLACKHOLE - this is the key!
  - Sets protocol to RTPROT_OVN (protocol 84) so they can be identified later
  - Sends to kernel, which installs the route in the specified VRF table

  Step 7: FRR Picks Up the Routes

  Once the blackhole routes are installed in the kernel VRF, FRR's redistribute kernel configuration (in the VRF BGP context) automatically detects them and advertises via BGP.

  Key Timing and Lifecycle

  1. When VRF is created: On first ovn-controller iteration after seeing dynamic-routing-maintain-vrf=true
  2. When routes are installed: Every time ovn-controller runs and processes Advertised_Route entries
  3. Route updates: Synchronized continuously - stale routes are removed, new ones added
  4. VRF cleanup: When dynamic-routing-maintain-vrf is removed or chassis loses binding, VRF is deleted

  Why Blackhole Routes?

  The routes are marked as RTN_BLACKHOLE because:
  - They are markers for FRR to advertise, not for actual packet forwarding
  - OVN handles the actual packet forwarding through OpenFlow rules
  - If a packet somehow reaches the kernel and matches one of these routes, it will be dropped (blackholed)
  - This prevents routing loops and ensures all traffic goes through OVN's datapath
Impressive, right?
Let’s now try to do something with the environment!
3. Modify the environment to advertise internal IPs via BGP
One potential modification to this test is to advertise the internal IP address of the guest VM (192.168.10.10) and ping it from the ToR. Instead of changing the code of the test I’ll modify the live environment to advertise the route to the VM and use Claude to handhold me.
First, verify that the VM is not reachable.
# podman exec ovn-gw-2 ip netns exec frr-ns ping -c 1 192.168.10.10
ping: connect: Network is unreachable
Now, since the ToRs are on different ASNs and are not connected, we will only be able to access the VM from the ToR where the DGP is bound. In our environment, the active gateway is on the gw-2 node. On a typical datacenter with a spine-and-leaf topology, the ToRs will be in the same AS and will be connected through the spine so we could reach the VM from anywhere in the network.
> I would like the lr-guest to advertise the route to 192.168.10.10, how can i enable that option?

⏺ To make lr-guest advertise its connected routes, you need to configure dynamic routing on lr-guest itself and on its router ports. Here's how:

  Step 1: Enable dynamic routing on lr-guest

  podman exec ovn-central-az1 ovn-nbctl set logical_router lr-guest \
      options:dynamic-routing=true \
      options:dynamic-routing-vrf-id=100

  Step 2: Configure the router ports to redistribute connected routes

  You need to set dynamic-routing-redistribute on the ports where you want to advertise routes from:

  # Advertise from the port connected to ls-guest-ovn-gw-1
  podman exec ovn-central-az1 ovn-nbctl set logical_router_port lrp-guest-ls-guest-ovn-gw-1 \
      options:dynamic-routing-redistribute=connected

  # Advertise from the port connected to ls-guest-ovn-gw-2
  podman exec ovn-central-az1 ovn-nbctl set logical_router_port lrp-guest-ls-guest-ovn-gw-2 \
      options:dynamic-routing-redistribute=connected

  However, there's a critical limitation here:

  - lr-guest is only instantiated on the chassis where the DGP is active (ovn-gw-2)
  - The VRF (ovnvrf100) will only be created on ovn-gw-2
  - Routes from lr-guest won't propagate to the gateway routers (lr-ovn-gw-1-ext0, lr-ovn-gw-2-ext0) automatically

  To actually make this work end-to-end, you would still need the static routes approach on the gateway routers, because OVN doesn't automatically propagate routes between different logical routers.

  The dynamic-routing-redistribute=connected on lr-guest would be useful if you had FRR running directly in the lr-guest VRF (ovnvrf100), but in this test topology, the BGP peering is happening in the gateway router VRFs (ovnvrf10, ovnvrf20), not in lr-guest's VRF.

  So the answer is: you can enable it, but it won't achieve what you want without also adding the static routes on the gateway routers.
This looks sane but still it does not seem that we’re telling OVN to create the VRF 100 and also FRR won’t be reading any routes from that VRF. Claude has missed that part, let’s talk about it 🙂
> if i understood you correctly earlier, we still need to add the maintain-vrf option to the LRP so that the vrf100 gets created

⏺ You're absolutely right! We need to add the maintain-vrf option to trigger vrf100 creation. Let me provide the complete configuration:

  # 1. Set maintain-vrf=true on the DGP to create vrf100
  # This is the critical step that triggers VRF creation in ovn-controller
  podman exec -it ovn-central-az1 \
    ovn-nbctl set logical_router_port lrp-guest-join-dgp \
    options:dynamic-routing-maintain-vrf=true

  # 2. Add static routes on gateway routers pointing to the DGP
  podman exec ovn-central-az1 ovn-nbctl lr-route-add lr-ovn-gw-2-ext0 \
      192.168.10.0/24 fe80::216:6ff:fe12:f00d lrp-ovn-gw-2-to-join


> FRR on ovn-gw-2 does not know anything about the vrf100. Can you help me adding the config to import this VRF?

⏺ You are right. Here's the configuration to add the import:

  podman exec -i ovn-gw-2 vtysh <<'EOF'
  configure
    router bgp 4210000000 vrf ovnvrf100
      bgp router-id 100.100.100.100
      no bgp ebgp-requires-policy
      address-family ipv4 unicast
        redistribute kernel
      exit-address-family
    exit
    router bgp 4210000000 vrf ovnvrf20
      address-family ipv4 unicast
        import vrf ovnvrf100
      exit-address-family
    exit
    write memory
  EOF

  This will:
  1. Create the BGP instance in ovnvrf100 that redistributes kernel routes (the blackhole route for 192.168.10.0/24)
  2. Add import vrf ovnvrf100 to the existing ovnvrf20 BGP configuration, so routes from vrf100 get leaked into vrf20 and advertised to the ToR


> Can you explain in detail what we have just done to reach 192.168.10.10 from the ToR?


⏺ Let me explain in detail how this works by tracing through the entire flow:

  1. OVN Configuration Creates the Foundation

  You've configured lr-guest with:
  - options:dynamic-routing=true
  - options:dynamic-routing-vrf-id=100
  - lrp-guest-join-dgp has options:dynamic-routing-maintain-vrf=true

  2. VRF Creation in Kernel

  On ovn-gw-2 (where the DGP is bound), ovn-controller sees the dynamic-routing-maintain-vrf=true option and calls re_nl_create_vrf() to create ovnvrf100 in the kernel with routing table ID 100.

  You can verify this:
  ssh ovnlab sudo podman exec ovn-gw-2 ip link show ovnvrf100
  ssh ovnlab sudo podman exec ovn-gw-2 ip route show vrf ovnvrf100

  3. Blackhole Route Installation

  When lr-guest has routes to advertise (like the connected network 192.168.10.0/24), ovn-controller queries the Advertised_Route table in the Southbound DB and installs blackhole routes in vrf100:

  ssh ovnlab sudo podman exec ovn-gw-2 ip route show vrf ovnvrf100 table 100
  # You should see something like:
  # blackhole 192.168.10.0/24 proto 84

  The route is marked as:
  - RTN_BLACKHOLE - doesn't actually route traffic, just a marker
  - RTPROT_OVN (protocol 84) - identifies it as an OVN-managed route

  This happens in route-exchange-netlink.c:98-121.

  4. FRR Sees the Kernel Route in vrf100

  When you configure:
  router bgp 4210000000 vrf ovnvrf100
    address-family ipv4 unicast
      redistribute kernel

  FRR monitors the kernel routing table for vrf100 (table 100) and sees the blackhole route for 192.168.10.0/24. Because of redistribute kernel, FRR adds this route to BGP's Routing Information Base (RIB) for vrf100.

  You can verify:
  ssh ovnlab "sudo podman exec ovn-gw-2 vtysh -c 'show ip bgp vrf ovnvrf100'"

  5. VRF Route Leaking (The Magic Part)

  When you configure in ovnvrf20:
  router bgp 4210000000 vrf ovnvrf20
    address-family ipv4 unicast
      import vrf ovnvrf100

  This tells FRR to import routes from vrf100's BGP RIB into vrf20's BGP RIB. This is called "VRF route leaking" or "route target import."

  Internally, FRR copies the 192.168.10.0/24 route from vrf100's BGP table into vrf20's BGP table.

  You can verify:
  ssh ovnlab "sudo podman exec ovn-gw-2 vtysh -c 'show ip bgp vrf ovnvrf20'"
  # Should now show 192.168.10.0/24 in addition to the NAT routes

  6. BGP Advertisement to ToR

  Once the route is in ovnvrf20's BGP RIB, the existing BGP session advertises it:
  router bgp 4210000000 vrf ovnvrf20
    neighbor ext0-bgp interface remote-as external
    address-family ipv4 unicast
      redistribute kernel
      neighbor ext0-bgp prefix-list no-default out

  The route gets advertised to the ToR peer via the ext0-bgp unnumbered BGP session.


  Key Points

  1. vrf100 has no external BGP peers - it's purely for internal route collection from lr-guest
  2. vrf20 has the actual ToR peering - it's where routes get advertised externally
  3. VRF import bridges the two - routes from vrf100 appear in vrf20's BGP table
  4. Blackhole routes are just markers - they don't route actual traffic, they just signal to FRR "advertise this prefix"
  5. This only works on ovn-gw-2 - because that's where the DGP (lrp-guest-join-dgp) is currently bound
And, of course, we can now ping the VM IP address from the ToR connected to ovn-gw-2:
$ podman exec -it ovn-central-az1 ovn-sbctl list advertised_route | grep 192.168.10 -C3
_uuid               : 1c417fc1-6af6-4945-9aaf-5443237a120a
datapath            : c1a7942f-bf59-4835-8c56-4df45a5c5855
external_ids        : {}
ip_prefix           : "192.168.10.0/24"
logical_port        : 782b2357-2c37-4e6f-bec6-ff204fcb4733
tracked_port        : []

$ podman exec ovn-gw-2 ip netns exec frr-ns ip route
172.16.10.2 nhid 6 via inet6 fe80::20fb:d6ff:fe66:992c dev ext1 proto bgp metric 20
192.168.10.0/24 nhid 6 via inet6 fe80::20fb:d6ff:fe66:992c dev ext1 proto bgp metric 20
192.168.20.0/24 nhid 6 via inet6 fe80::20fb:d6ff:fe66:992c dev ext1 proto bgp metric 20

$ podman exec ovn-gw-2 ip netns exec frr-ns ping -c 2 192.168.10.10
PING 192.168.10.10 (192.168.10.10) 56(84) bytes of data.
64 bytes from 192.168.10.10: icmp_seq=1 ttl=62 time=1.48 ms
64 bytes from 192.168.10.10: icmp_seq=2 ttl=62 time=0.575 ms

--- 192.168.10.10 ping statistics ---
2 packets transmitted, 2 received, 0% packet loss, time 1002ms
rtt min/avg/max/mdev = 0.575/1.027/1.479/0.452 ms
Conclusions
This combination of code analysis + live system inspection + domain knowledge made understanding the feature much faster than traditional code reading alone. Even for someone familiar with OVN, having AI as a “knowledgeable assistant” that can quickly locate and explain specific implementation details is awesome! It’s been very handy for:
- Rapid ramp-up on the new BGP integration feature as a user
- Tracing execution paths across multiple source files without manually grepping through thousands of lines
- Understanding the “how” and “why” of implementation details like the VRF creation
- Connecting the dots between configuration options and actual kernel-level operations
Claude is definitely getting a permanent route in my learning topology. Next hop: more complex features! 😉