One of the great things of OVN is that North/South routing can happen locally in the hypervisor when a ‘dnat_and_snat‘ rule is used (aka Floating IP) without having to go through a central or network node.
The way it works is that when outgoing traffic reaches the OVN bridge, the source IP address is changed by the Floating IP (snat) and pushed out to the external network. Similarly, when the packet comes in, the Floating IP address is changed (dnat) by that of the virtual machine in the private network.
In the OpenStack world, this is called DVR (“Distributed Virtual Routing”) as the routing doesn’t need to traverse any central node and happens on compute nodes meaning no extra hops, no overlay traffic and distributed routing processing.
The main advantage is that if all your workloads have a Floating IP and a lot of N/S traffic, the cloud can be well dimensioned and it’s very scalable (no need to scale any network/gateway nodes as you scale out the number of computes and less dependency on the control plane). The drawback is that you’ll need to consume IP addresses from the FIP pool. Yeah, it couldn’t be all good news :p
All this introduction to say that during some testing on an OVN cluster with lots of Floating IPs, we noticed that the amount of Logical Flows was *huge* and that led to numerous problems related to a very high CPU and memory consumption on both server (ovsdb-server) and client (ovn-controller) sides.
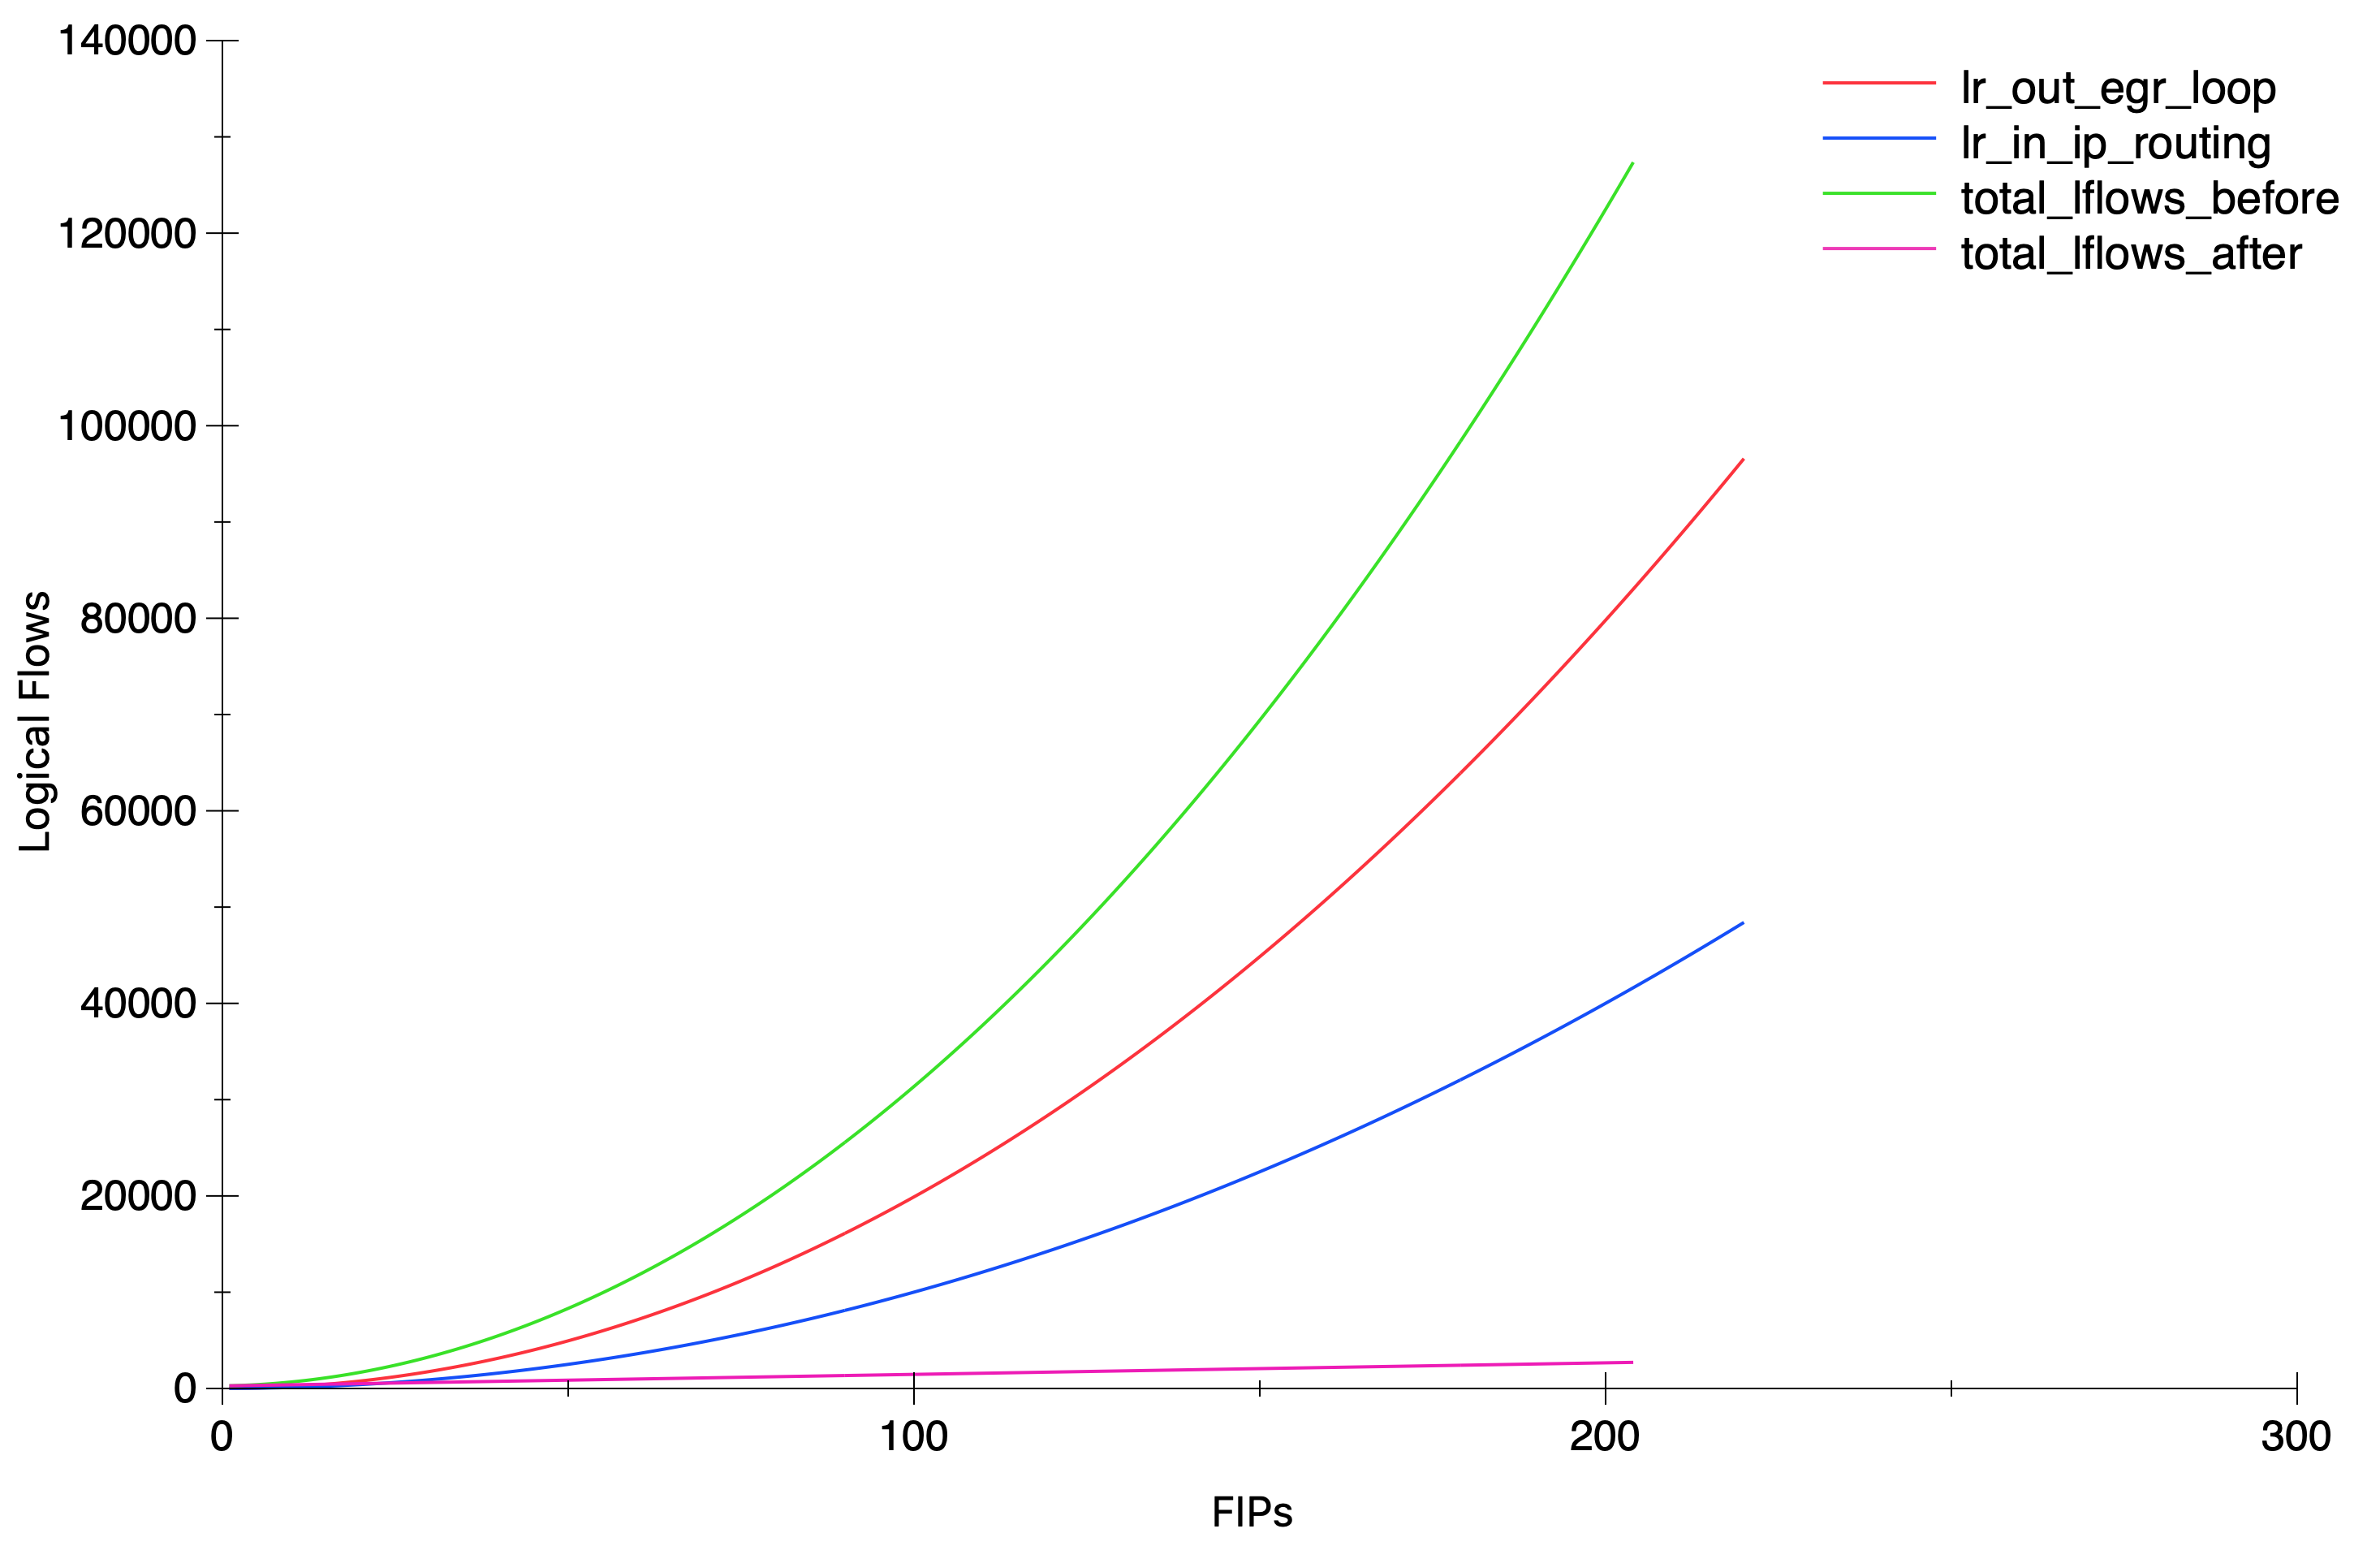
I wanted to understand how the flows were distributed and what was the main contributor(s) to this explosion. What I did is simply count the number of flows on every stage and sorting them. This showed that 93% of all the Logical Flows were in two stages:
$ head -n 6 logical_flows_distribution_sorted.txt
lr_out_egr_loop: 423414  62.24%
lr_in_ip_routing: 212199  31.19%
lr_in_ip_input: 10831  1.59%
ls_out_acl: 4831  0.71%
ls_in_port_sec_ip: 3471  0.51%
ls_in_l2_lkup: 2360  0.34%
Here’s the simple commands that I used to figure out the flow distribution:
# ovn-sbctl list Logical_Flow > logical_flows.txt

# Retrieve all the stages in the current pipeline
$ grep ^external_ids logical_flows.txt | sed 's/.*stage-name=//' | tr -d '}' | sort | uniq

# Count how many flows on each stage
$ while read stage; do echo $stage: $(grep $stage logical_flows.txt -c); done < stage_names.txt  > logical_flows_distribution.txt

$ sort  -k 2 -g -r logical_flows_distribution.txt  > logical_flows_distribution_sorted.txt
Next step would be to understand what’s in those two tables (lr_out_egr_loop & lr_in_ip_routing):
_uuid               : e1cc600a-fb9c-4968-a124-b0f78ed8139f
actions             : "next;"
external_ids        : {source="ovn-northd.c:8958", stage-name=lr_out_egr_loop}
logical_datapath    : 9cd315f4-1033-4f71-a26e-045a379aebe8
match               : "ip4.src == 172.24.4.10 && ip4.dst == 172.24.4.209"
pipeline            : egress
priority            : 200
table_id            : 2
hash                : 0

_uuid               : c8d8400a-590e-4b7e-b433-7a1491d31488
actions             : "inport = outport; outport = \"\"; flags = 0; flags.loopback = 1; reg9[1] = 1; next(pipeline=ingress, table=0); "
external_ids        : {source="ovn-northd.c:8950", stage-name=lr_out_egr_loop}
logical_datapath    : 9cd315f4-1033-4f71-a26e-045a379aebe8
match               : "is_chassis_resident(\"vm1\") && ip4.src == 172.24.4.218 && ip4.dst == 172.24.4.220"
pipeline            : egress
priority            : 300
table_id            : 2
hash                : 0
_uuid               : 0777b005-0ff0-40cb-8532-f7e2261dae06
actions             : "outport = \"router1-public\"; eth.src = 40:44:00:00:00:06; eth.dst = 40:44:00:00:00:07; reg0 = ip4.dst; reg1 = 172.24.4.218; reg9[2] = 1; reg9[0] = 0; ne
xt;"
external_ids        : {source="ovn-northd.c:6945", stage-name=lr_in_ip_routing}
logical_datapath    : 9cd315f4-1033-4f71-a26e-045a379aebe8
match               : "inport == \"router1-net1\" && ip4.src == 192.168.0.11 && ip4.dst == 172.24.4.226"
pipeline            : ingress
priority            : 400
table_id            : 9
hash                : 0
Turns out that those flows are intended to handle inter-FIP communication. Basically, there are flows for every possible FIP pair so that the traffic doesn’t flow through a Geneve tunnel.
While FIP-to-FIP traffic between two OVN ports is not perhaps the most common use case, those flows are there to handle it that way that the traffic would be distributed and never sent through the overlay network.
A git blame on the code that generates those flows will show the commits [1][2] and some background on the actual issue.
With the results above, one would expect a quadratic growth but still, it’s always nice to pull some graphs 🙂

And again, the simple script that I used to get the numbers in the graph:
ovn-nbctl clear logical_router router1 nat
for i in {1..200}; do
  ovn-nbctl lr-nat-add router1 dnat_and_snat 172.24.4.$i 192.168.0.11 vm1 40:44:00:00:00:07
  # Allow some time to northd to generate the new lflows.
  ovn-sbctl list logical_flow > /dev/null
  ovn-sbctl list logical_flow > /tmp/lflows.txt
  S1=$(grep lr_out_egr_loop -c /tmp/lflows.txt )
  S2=$(grep lr_in_ip_routing -c /tmp/lflows.txt )
  echo $S1 $S2
done
Soon after I reported this scaling issue with the above findings, my colleague Numan did an amazing job fixing it with this patch. The results are amazing and for the same test scenario with 200 FIPs, the total amount of lflows dropped from ~127K to ~2.7K and most importantly, from an exponential to a linear growth.

Since the Logical Flows are represented in ASCII, they are also quite expensive in processing due to the string parsing, and not very cheap to transmit in the OVSDB protocol. This has been a great leap when it comes to scaling scaling environments with a heavy N/S traffic and lots of Floating IPs.